Home /
Expert Answers /
Mechanical Engineering /
on-the-breakeven-graph-below-what-does-the-sum-of-line-a-and-line-b-represent-break-even-analysis-pa547
(Solved): On the breakeven graph below what does the sum of Line A and Line B represent? Break Even Analysis ...
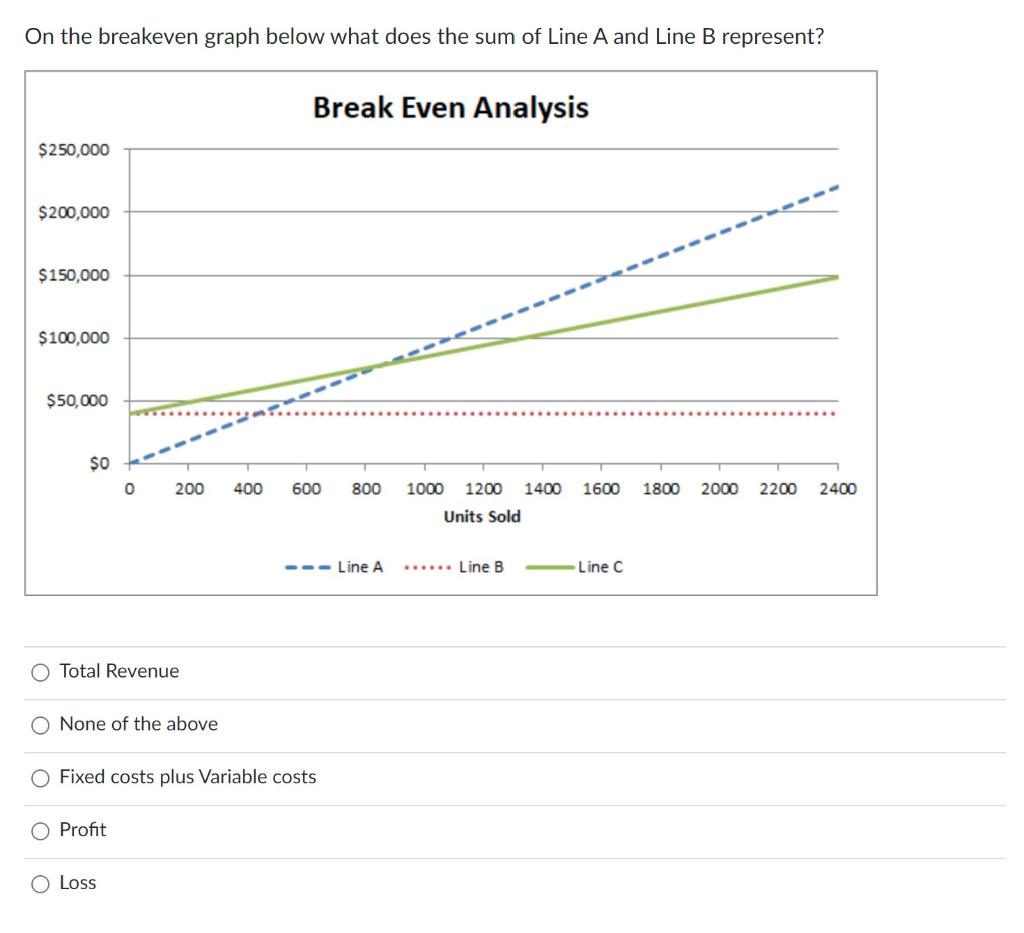
On the breakeven graph below what does the sum of Line A and Line B represent? Break Even Analysis $250,000 $200,000 $150,000 $100,000 $50,000 so 0 200 400 600 800 1000 1200 1400 1600 1800 2000 2200 2400 Units Sold ---Line A ...... Line B Line C Total Revenue O None of the above Fixed costs plus Variable costs Profit O Loss
Expert Answer
Line A represent the total revenue. Line B represent