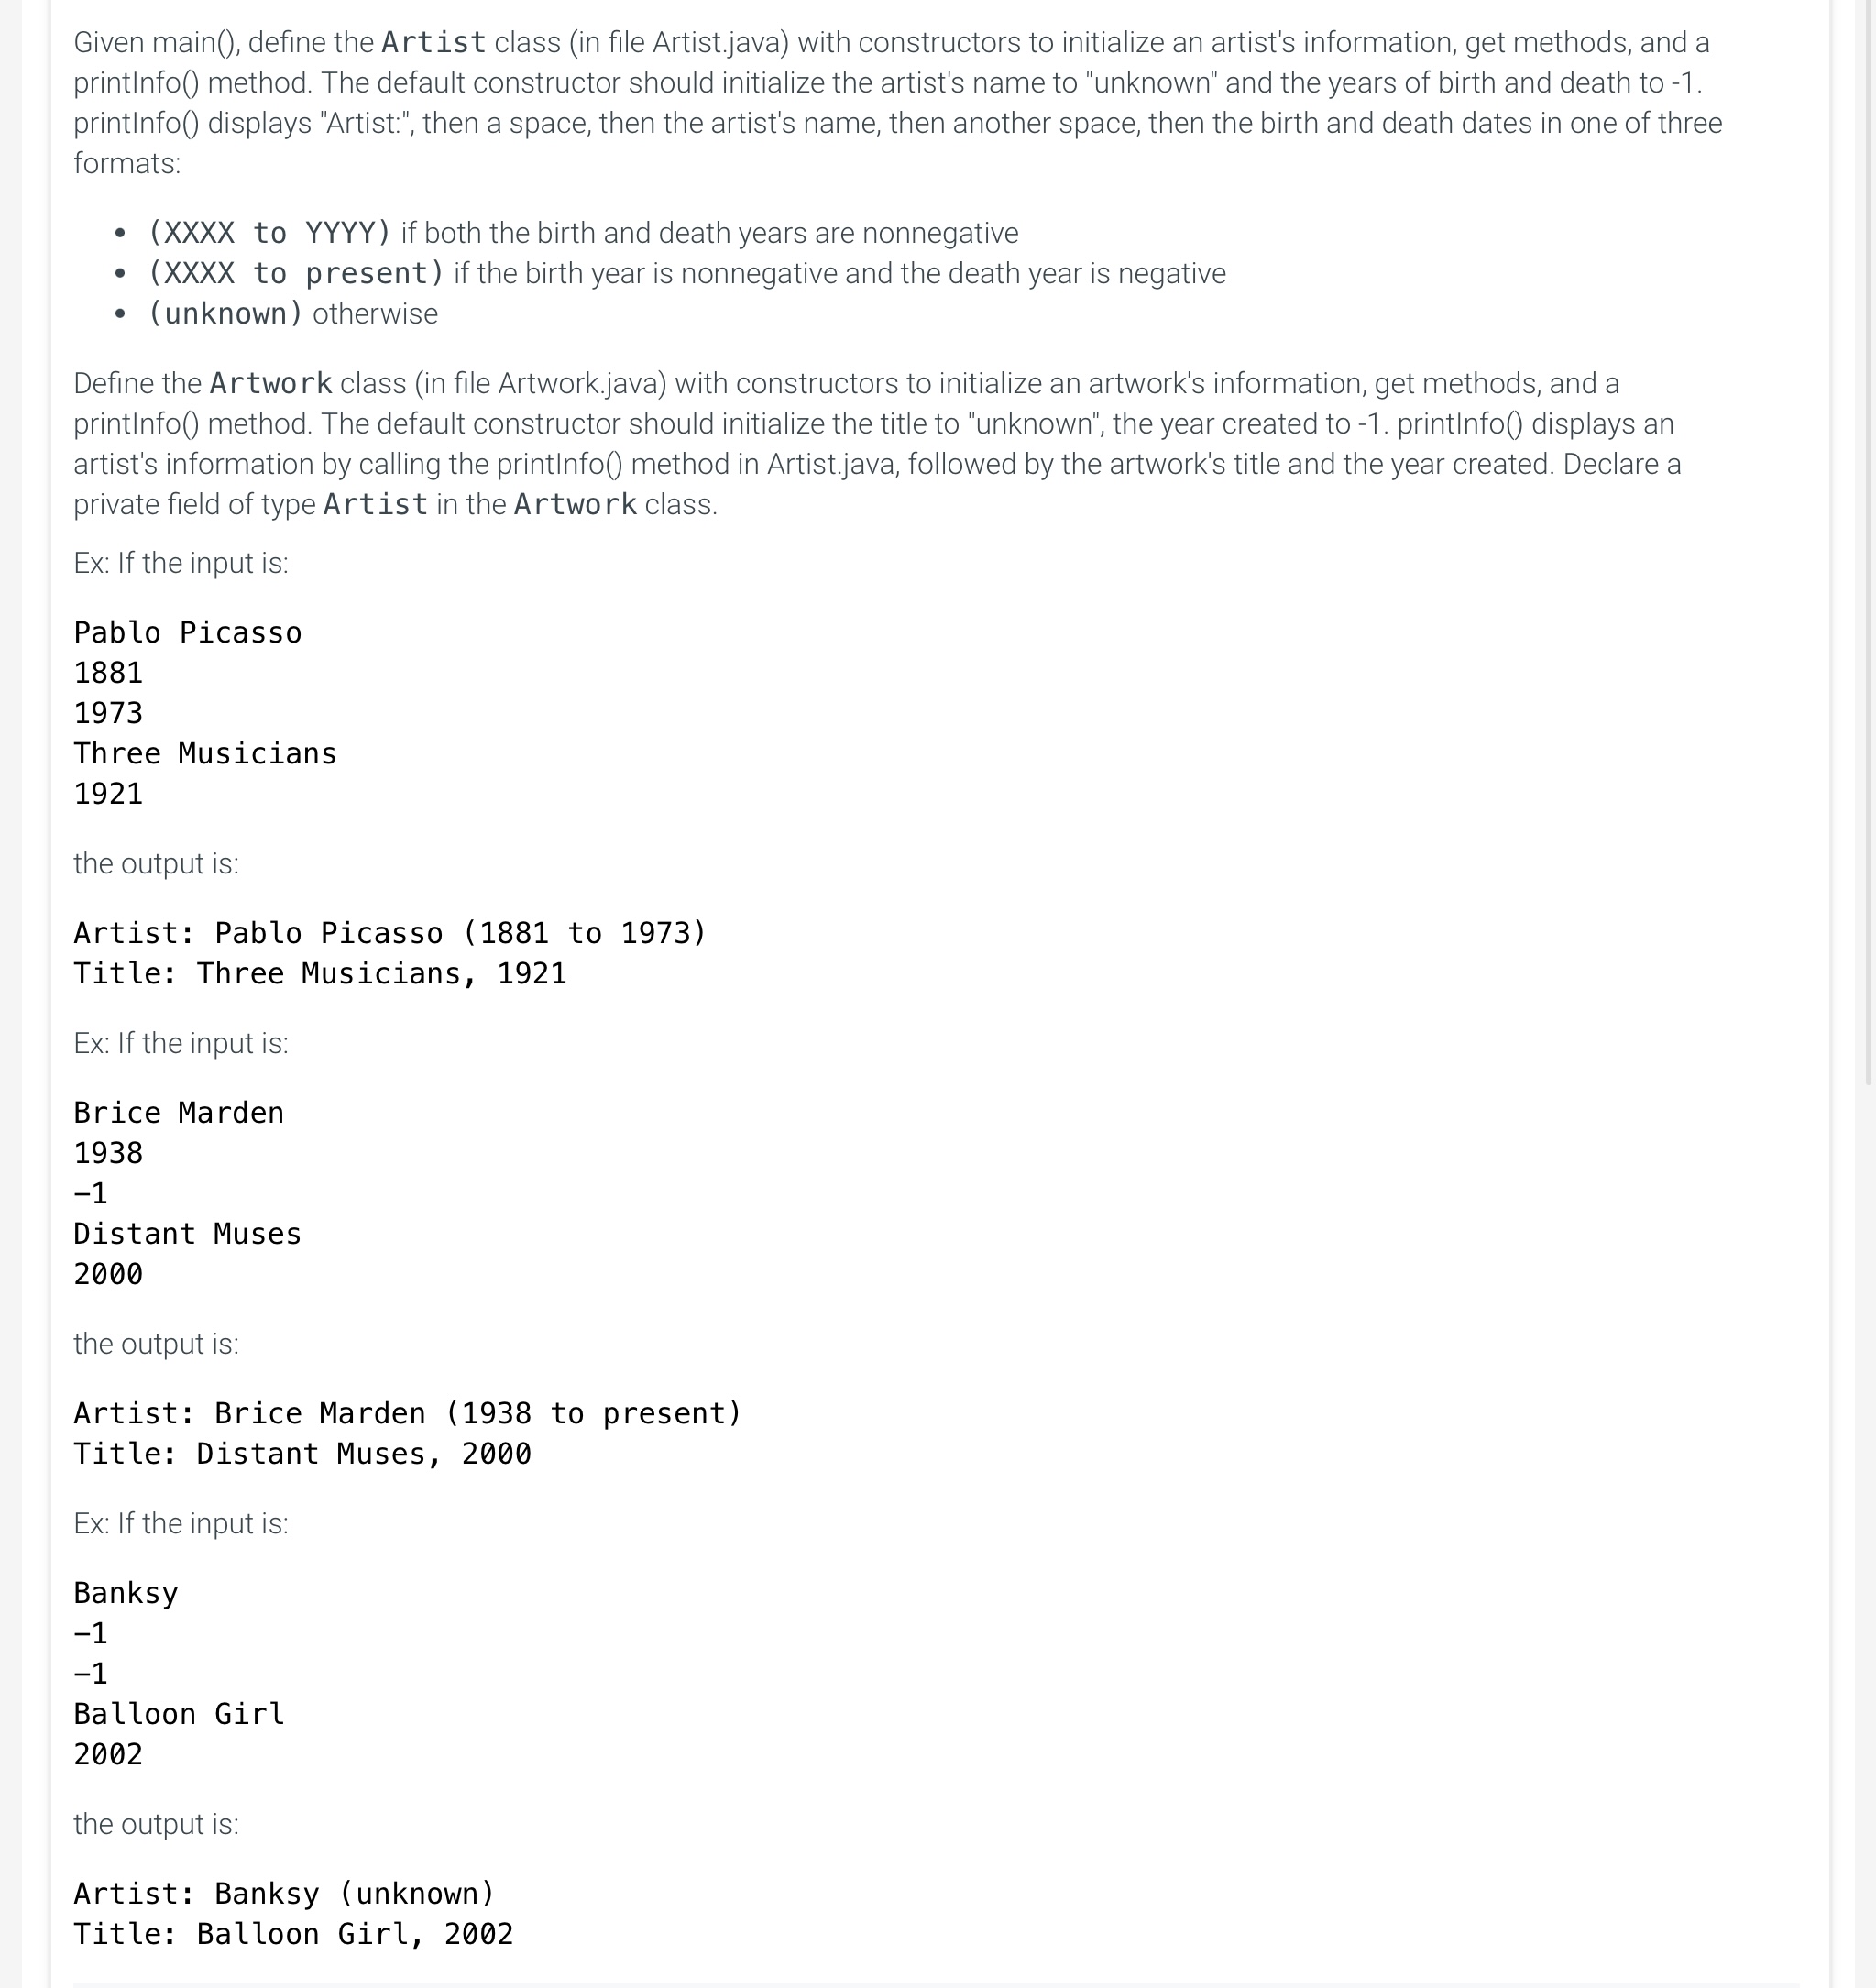
Given main(), define the Artist class (in file Artist.java) with constructors to initialize an artist's information, get methods, and a printInfo() method. The default constructor should initialize the artist's name to "unknown" and the years of birth and death to -1. printInfo() displays "Artist:", then a space, then the artist's name, then another space, then the birth and death dates in one of three formats:
- (XXXX to YYYY) if both the birth and death years are nonnegative
- (XXXX to present) if the birth year is nonnegative and the death year is negative
- (unknown) otherwise
Define the Artwork class (in file Artwork.java) with constructors to initialize an artwork's information, get methods, and a printInfo() method. The default constructor should initialize the title to "unknown", the year created to -1. printInfo() displays an artist's information by calling the printInfo() method in Artist.java, followed by the artwork's title and the year created. Declare a private field of type Artist in the Artwork class.
Ex: If the input is:
Pablo Picasso
1881
1973
Three Musicians
1921
the output is:
Artist: Pablo Picasso (1881 to 1973)
Title: Three Musicians, 1921
Ex: If the input is:
Brice Marden
1938
-1
Distant Muses
2000
the output is:
Artist: Brice Marden (1938 to present)
Title: Distant Muses, 2000
Ex: If the input is:
Banksy
-1
-1
Balloon Girl
2002
the output is:
Artist: Banksy (unknown)
Title: Balloon Girl, 2002


PLEASE ANSWER IN THE ABOVE FORMAT(JAVA)
Given main(), define the Art ist class (in file Artist.java) with constructors to initialize an artist's information, get methods, and a printInfo() method. The default constructor should initialize the artist's name to "unknown" and the years of birth and death to -1 . printInfo() displays "Artist:", then a space, then the artist's name, then another space, then the birth and death dates in one of three formats: - (XXXX to YYYY) if both the birth and death years are nonnegative - (XXXX to present) if the birth year is nonnegative and the death year is negative - (unknown) otherwise Define the Artwork class (in file Artwork.java) with constructors to initialize an artwork's information, get methods, and a printInfo() method. The default constructor should initialize the title to "unknown", the year created to -1. printlnfo() displays an artist's information by calling the printInfo() method in Artist.java, followed by the artwork's title and the year created. Declare a private field of type Artist in the Artwork class. Ex: If the input is: Pablo Picasso 1881 1973 Three Musicians 1921 the output is: Artist: Pablo Picasso (1881 to 1973) Title: Three Musicians, 1921 Ex: If the input is: Brice Marden 1938 −1 Distant Muses 2000 the output is: Artist: Brice Marden (1938 to present) Title: Distant Muses, 2000 Ex: If the input is: Banksy −1 −1 Balloon Girl 2002 the output is: Artist: Banksy (unknown) Title: Balloon Girl, 2002
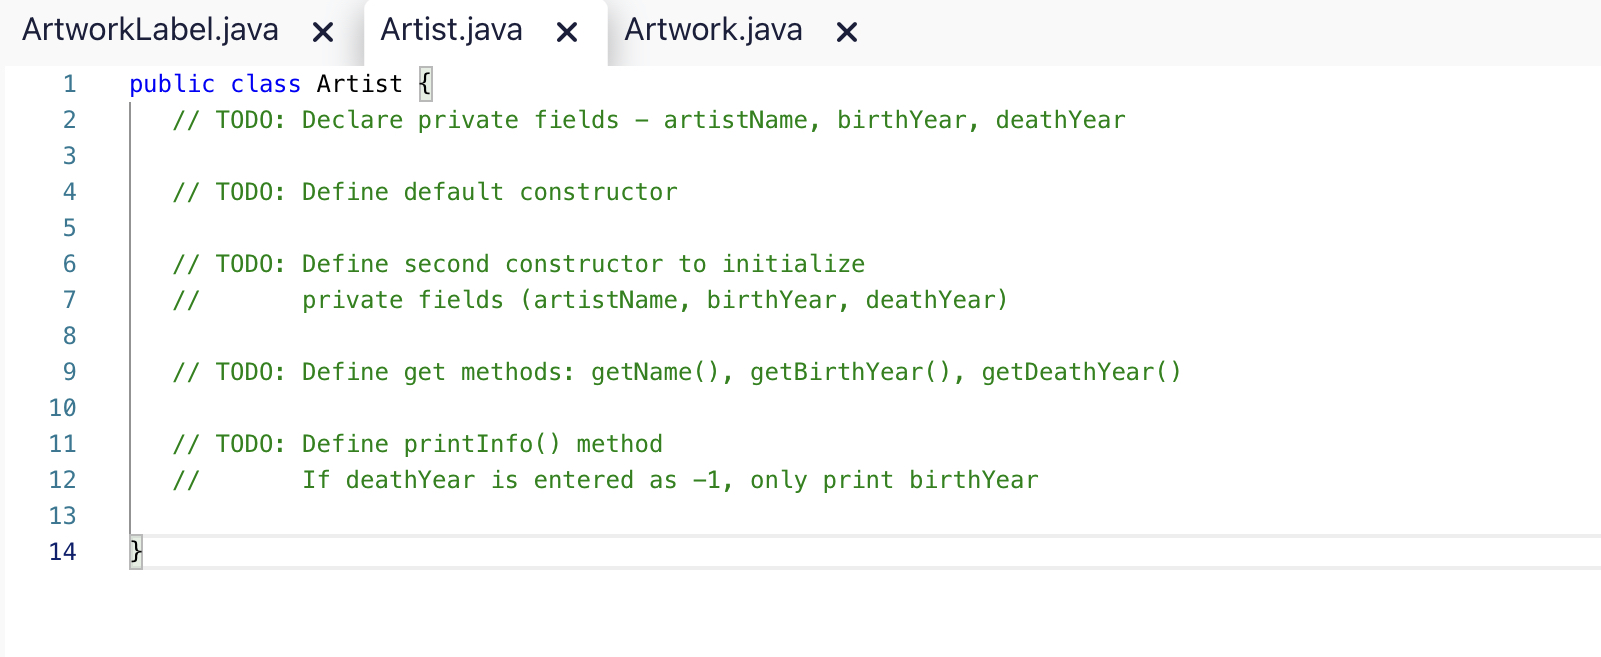
ArtworkLabel.java × Artist.java × Artwork.java × public class Artist \{ // TODO: Declare private fields - artistName, birthYear, deathYear // TOD0: Define default constructor // TODO: Define second constructor to initialize // private fields (artistName, birthYear, deathYear) // TOD0: Define get methods: getName(), getBirthYear(), getDeathYear() // TODO: Define printInfo() method // If deathYear is entered as -1 , only print birthYear
public class Artwork \{ // TODO: Declare private fields - title, yearcreated // TODO: Declare private field artist of type Artist // TODO: Define default constructor // TOD0: Define get methods: getTitle(), getYearCreated() // TODO: Define second constructor to initialize // private fields (title, yearCreated, artist) // TOD0: Define printInfo() method // Call the printInfo() method in Artist.java to print an artist's information 15 \begin{tabular}{l|l} 16 \end{tabular}