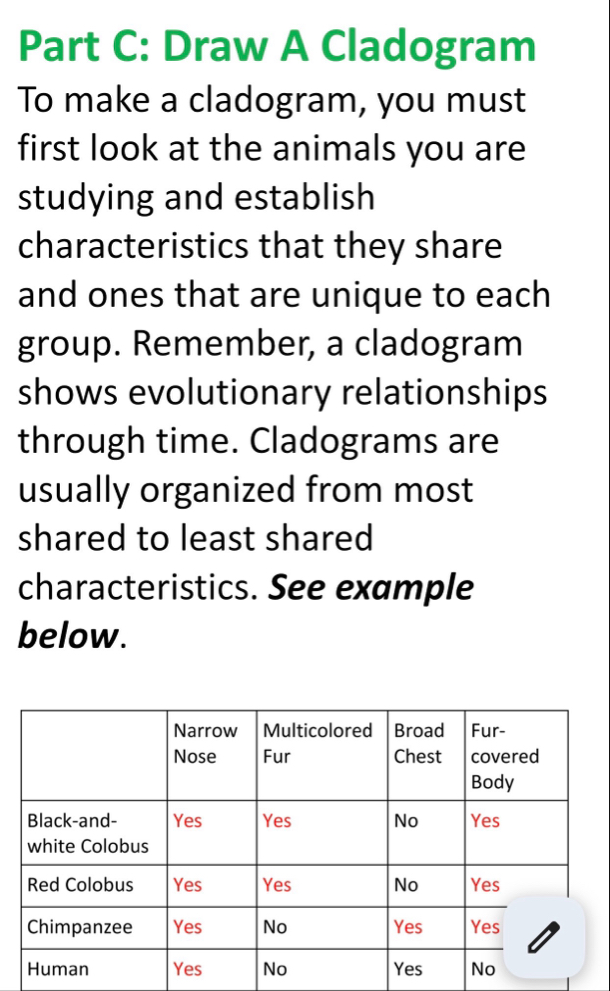
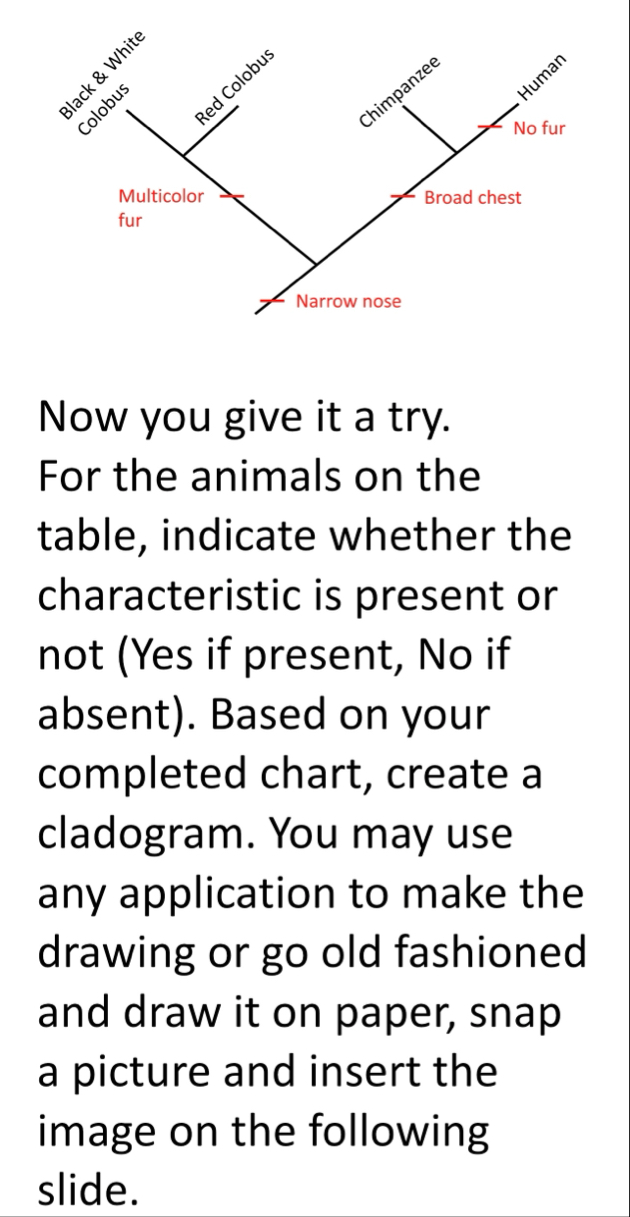
(Solved): Part C: Draw A Cladogram To make a cladogram, you must first look at the animals you are studying an ...
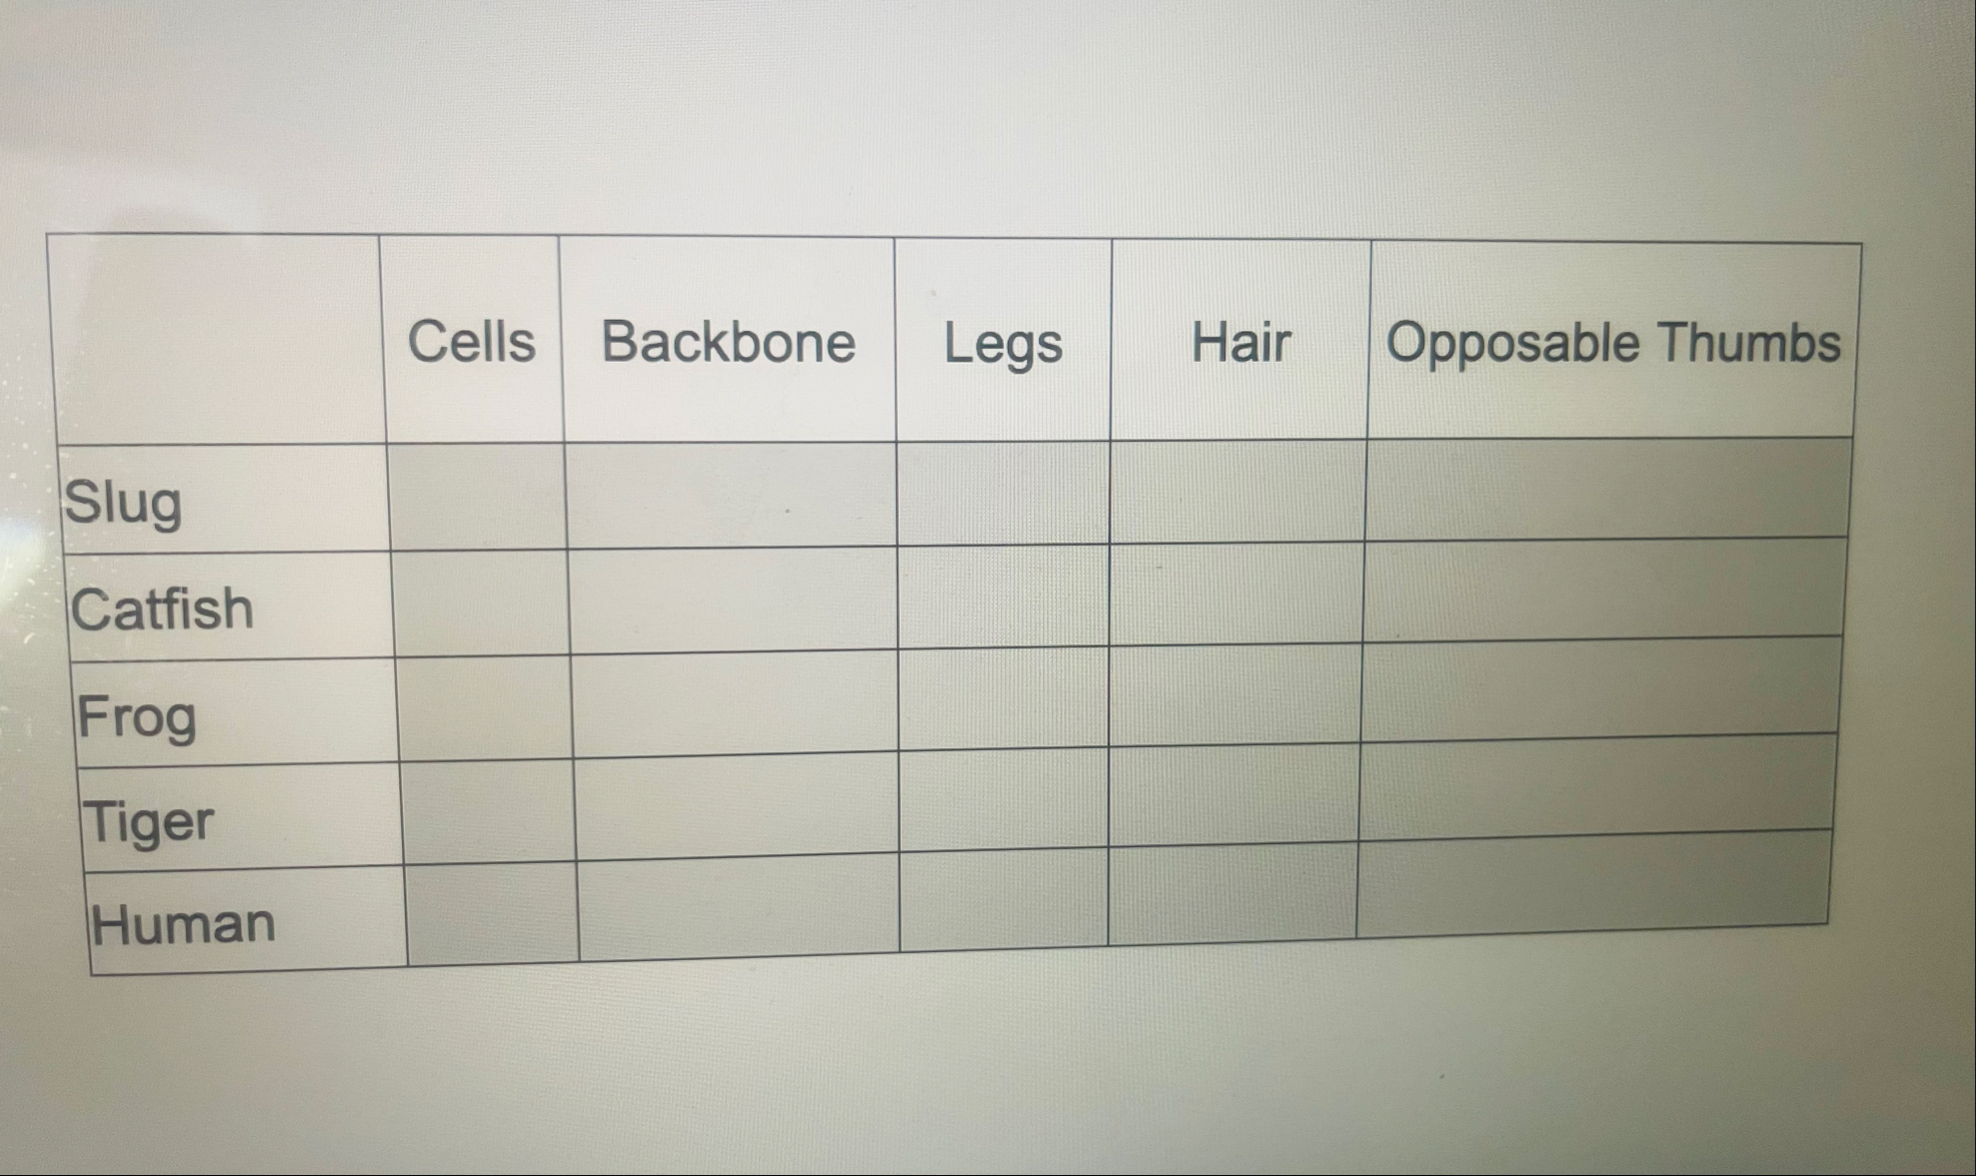
Part C: Draw A Cladogram To make a cladogram, you must first look at the animals you are studying and establish characteristics that they share and ones that are unique to each group. Remember, a cladogram shows evolutionary relationships through time. Cladograms are usually organized from most shared to least shared characteristics. See example below. \table[[,Narrow Nose,Multicolored Fur,Broad Chest,Furcovered Body],[Black-andwhite Colobus,Yes,Yes,No,Yes],[Red Colobus,Yes,Yes,No,Yes],[Chimpanzee,Yes,No,Yes,Yes],[Human,Yes,No,Yes,No]] Now you give it a try. For the animals on the table, indicate whether the characteristic is present or not (Yes if present, No if absent). Based on your completed chart, create a cladogram. You may use any application to make the drawing or go old fashioned and draw it on paper, snap a picture and insert the image on the following slide. \table[[,Cells,Backbone,Legs,Hair,Opposable Thumbs],[Slug,,,,,],[Catfish,,,,,],[Frog,,,,,],[Tiger,,,,,],[Human,,,,,]] Insert Cladogram Image Here