(Solved): Please Answer me ASAP, and Please do not copy from others' work. 1) Consider the graph ...
Please Answer me ASAP, and Please do not copy from others' work.
1)
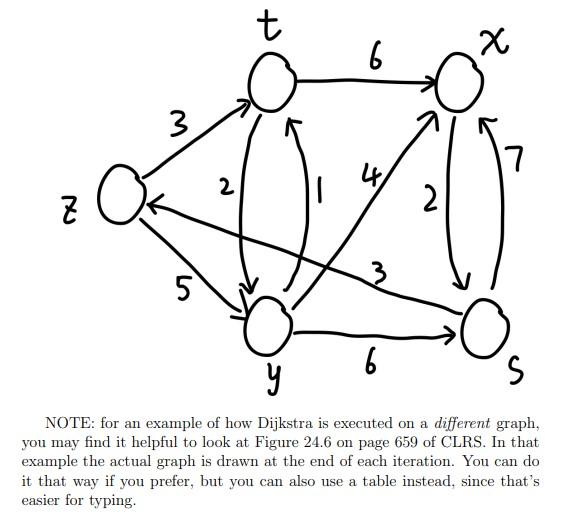
Consider the graph G in the figure below. Now consider running Dijkstra(G,s). (s is the bottom right vertex.)
Draw a table which indicates what the algorithm looks like after each execution of the while loop inside Dijkstra’s. In particular, for each iteration of the loop you should indicate
• which vertex is explored in that iteration
• what is the label d(v) for every vertex v at the end of that iteration.
• So all in all you should draw a table with 5 rows and 6 columns. Each row corresponds to an iteration of the while loop: so you can label the rows ”iteration 1”, ”iteration 2”, and so on up to ”iteration 5”. You then have six columns. The first column you should label ”explored vertex”, and this column indicates which vertex is explored in that iteration. You then have 5 other columns labeled d(z), d(t), d(x), d(y), and d(s), which show the label of each vertex at the end of every iteration.
Expert Answer
Dijkstra’s shortest-path algorithm to compute the shortest path from “s” to all other vertices of a graph is as follows Iteration Node N' D(s) P(s) D(