Home /
Expert Answers /
Statistics and Probability /
please-answer-q3-and-4-some-features-of-this-activity-may-not-work-well-on-a-pa414
(Solved): *********PLEASE ANSWER Q3 AND 4************ Some features of this activity may not work well on a ...
*********PLEASE ANSWER Q3 AND 4************
Some features of this activity may not work well on a cell phone or tablet. We highly recommend that you complete this activity on a computer. A list of StatCrunch directions is provided at the bottom of this text-box. Context The modern Olympic Games have changed dramatically since their inception in 1896. Are athletes getting better? We will use regression to investigate the change in winning times for one event-the men's 1,500 meter race. Variables Year: the year of the Olympic Games, from 1896 to 2000. Time: the winning time for the 1,500 meter race, in seconds. Since the winning time depends on the year, the Year since 1896 is the explanatory variable, and the Winning time is the response variable. Data The olympics datafile includes the winning times for the men's 1,500-meter race since 1896. Open the olympics datafile in the Stats at Cuyamaca College group on StatCrunch (directions - opens in a new tab). Prompt In the first two questions below, you will use StatCrunch to produce and examine the scatterplot for the olympics datafile. You will also use StatCrunch to find the regression equation and correlation coefficient.
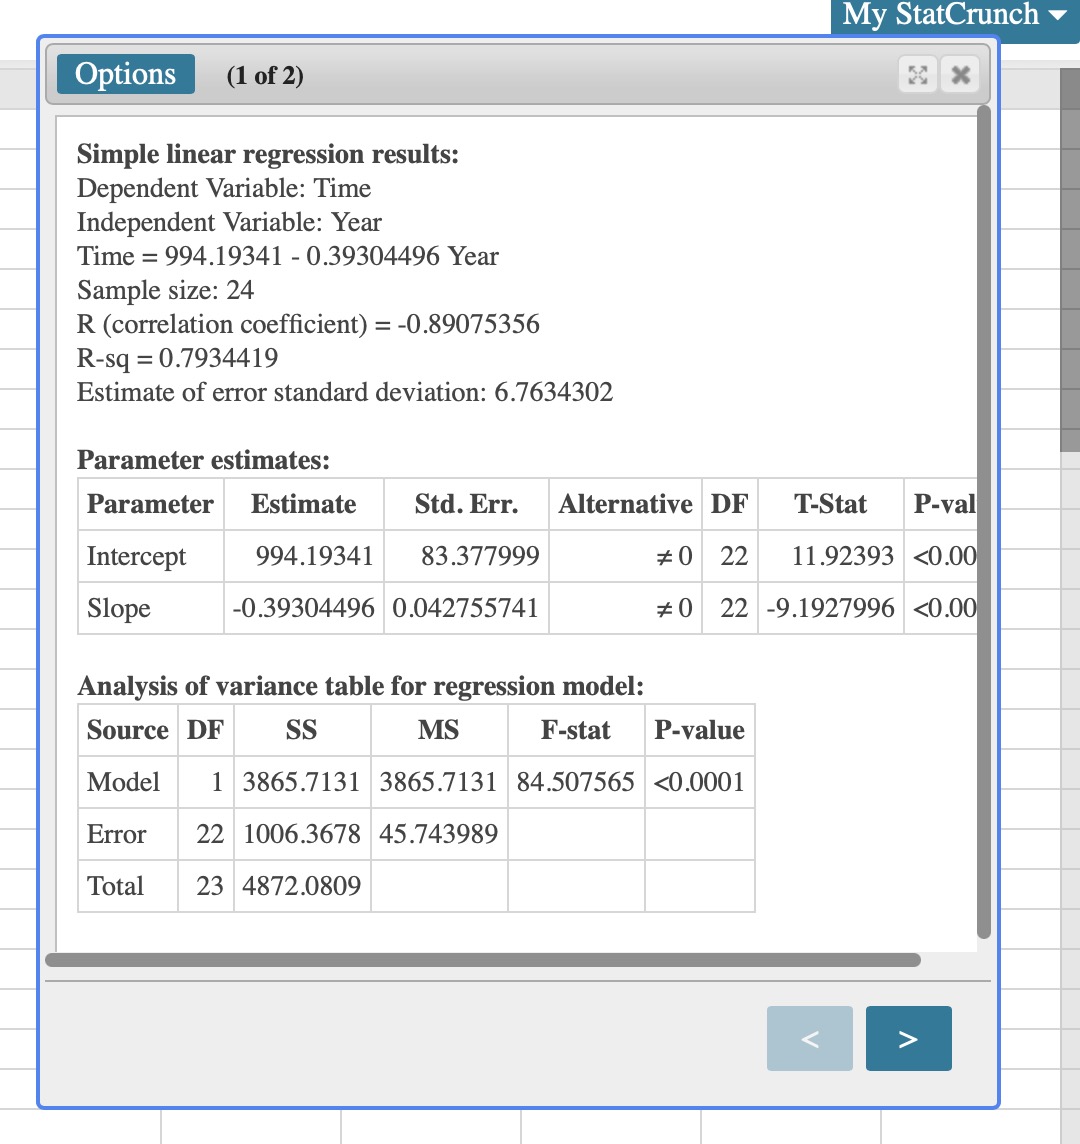
Simple linear regression results: Dependent Variable: Time Independent Variable: Year Time Year Sample size: 24 (correlation coefficient Estimate of error standard deviation: 6.7634302 Parameter estimates: Analysis of variance table for regression model:
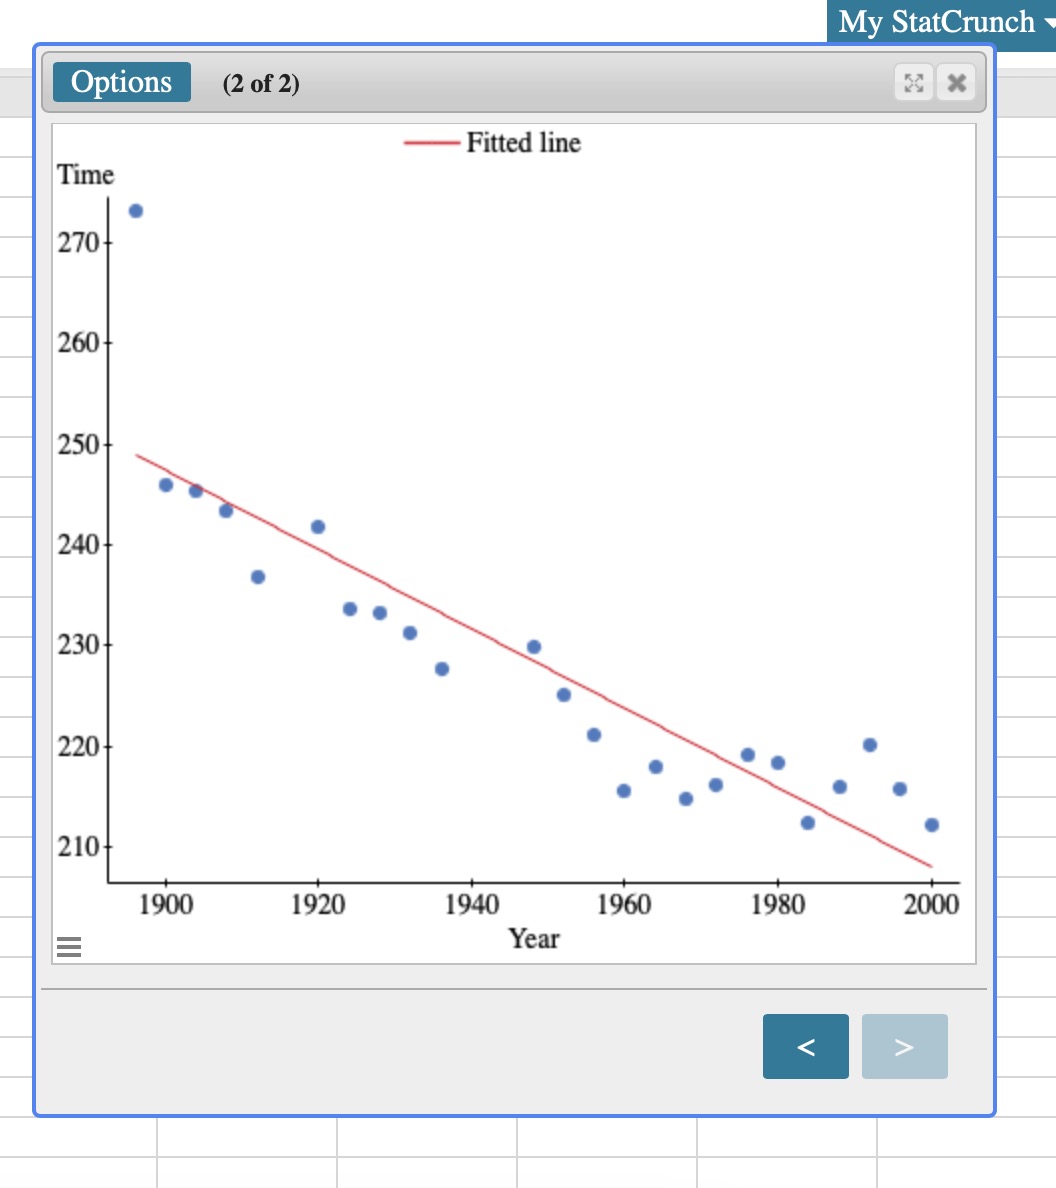
My StatCrunch (2 of 2) Fitted line
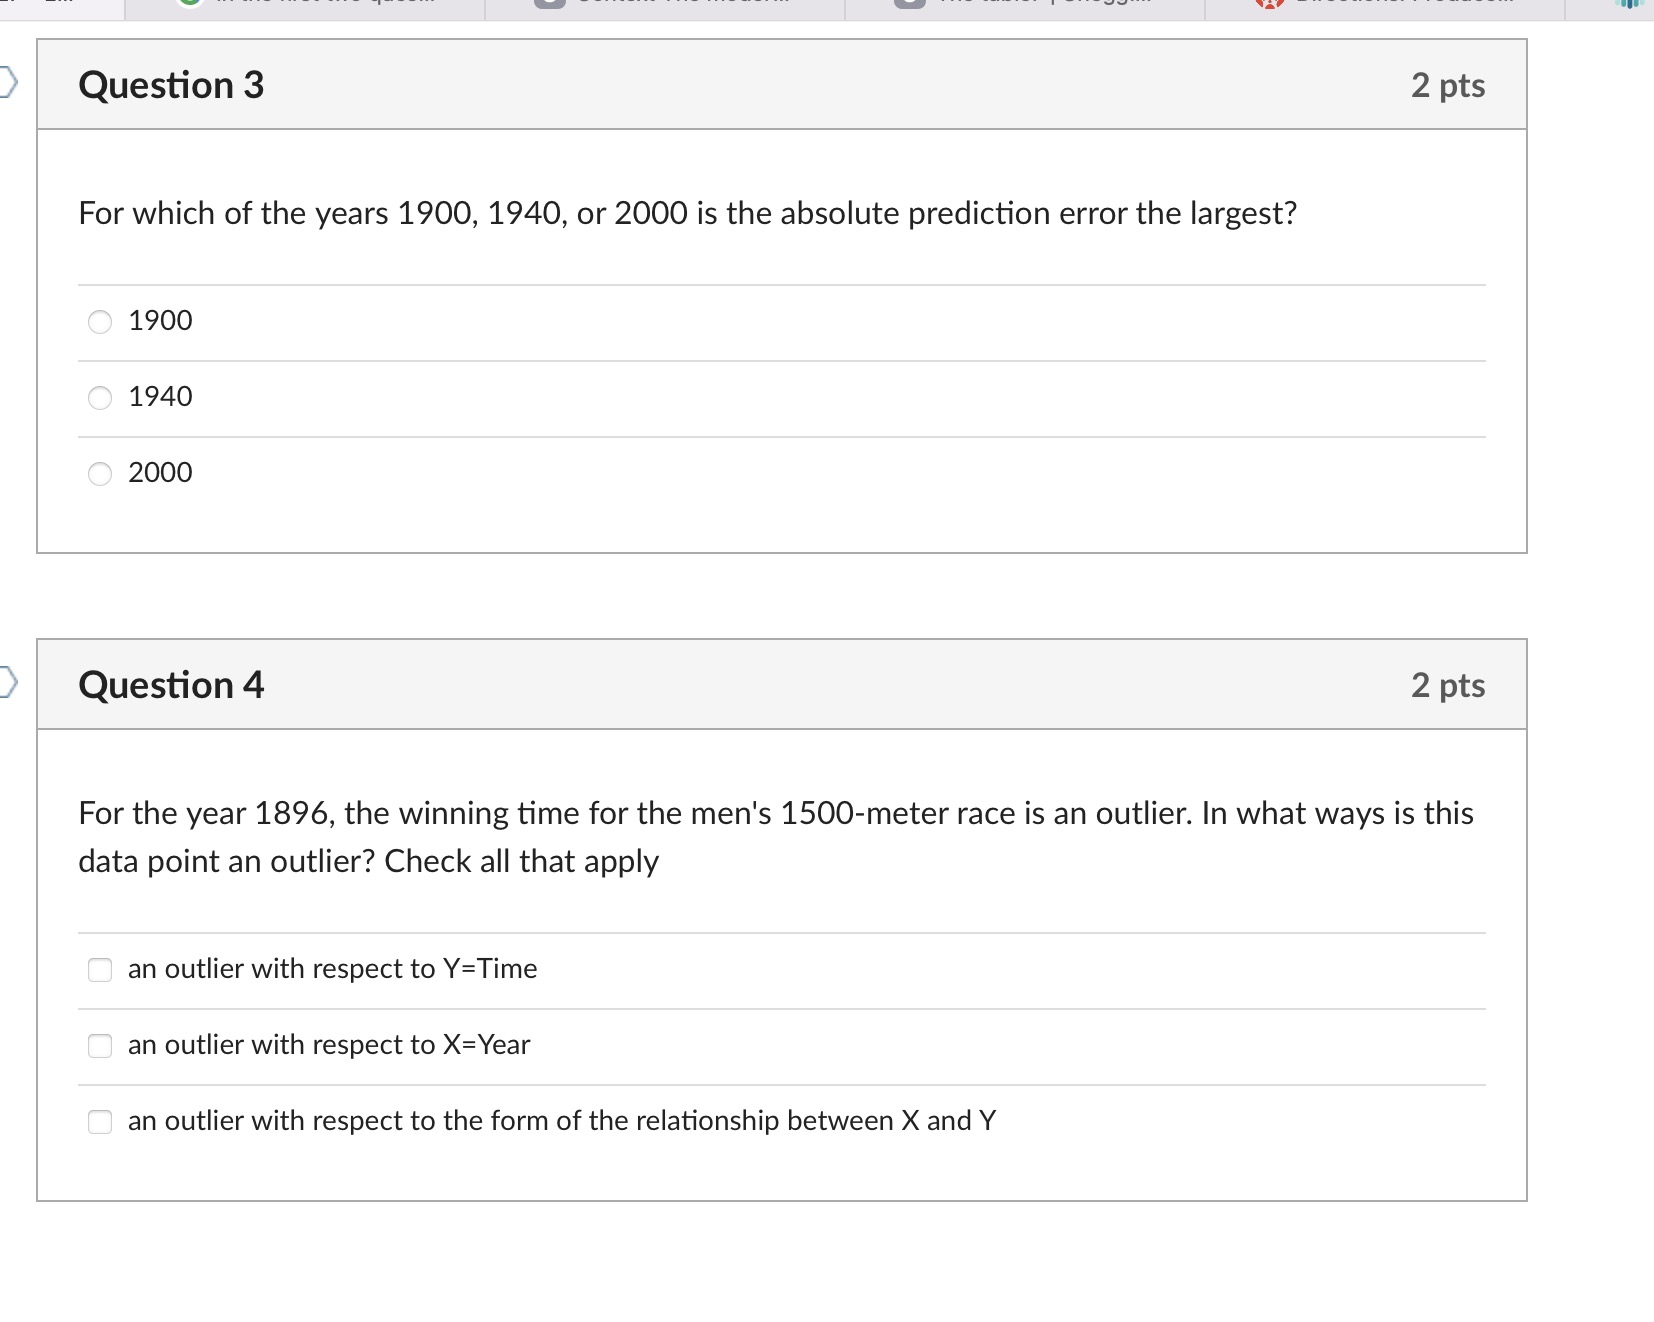
For which of the years 1900,1940 , or 2000 is the absolute prediction error the largest? \begin{tabular}{|l} \hline 1900 \\ \hline 1940 \\ \hline 2000 \end{tabular} Question 4 2 pts For the year 1896, the winning time for the men's 1500 -meter race is an outlier. In what ways is this data point an outlier? Check all that apply an outlier with respect to Time an outlier with respect to Year an outlier with respect to the form of the relationship between and
Expert Answer
From the scatterplot, ...