(Solved): Please get the optimal solution (list the system of two equations and solve it with details): How mu ...
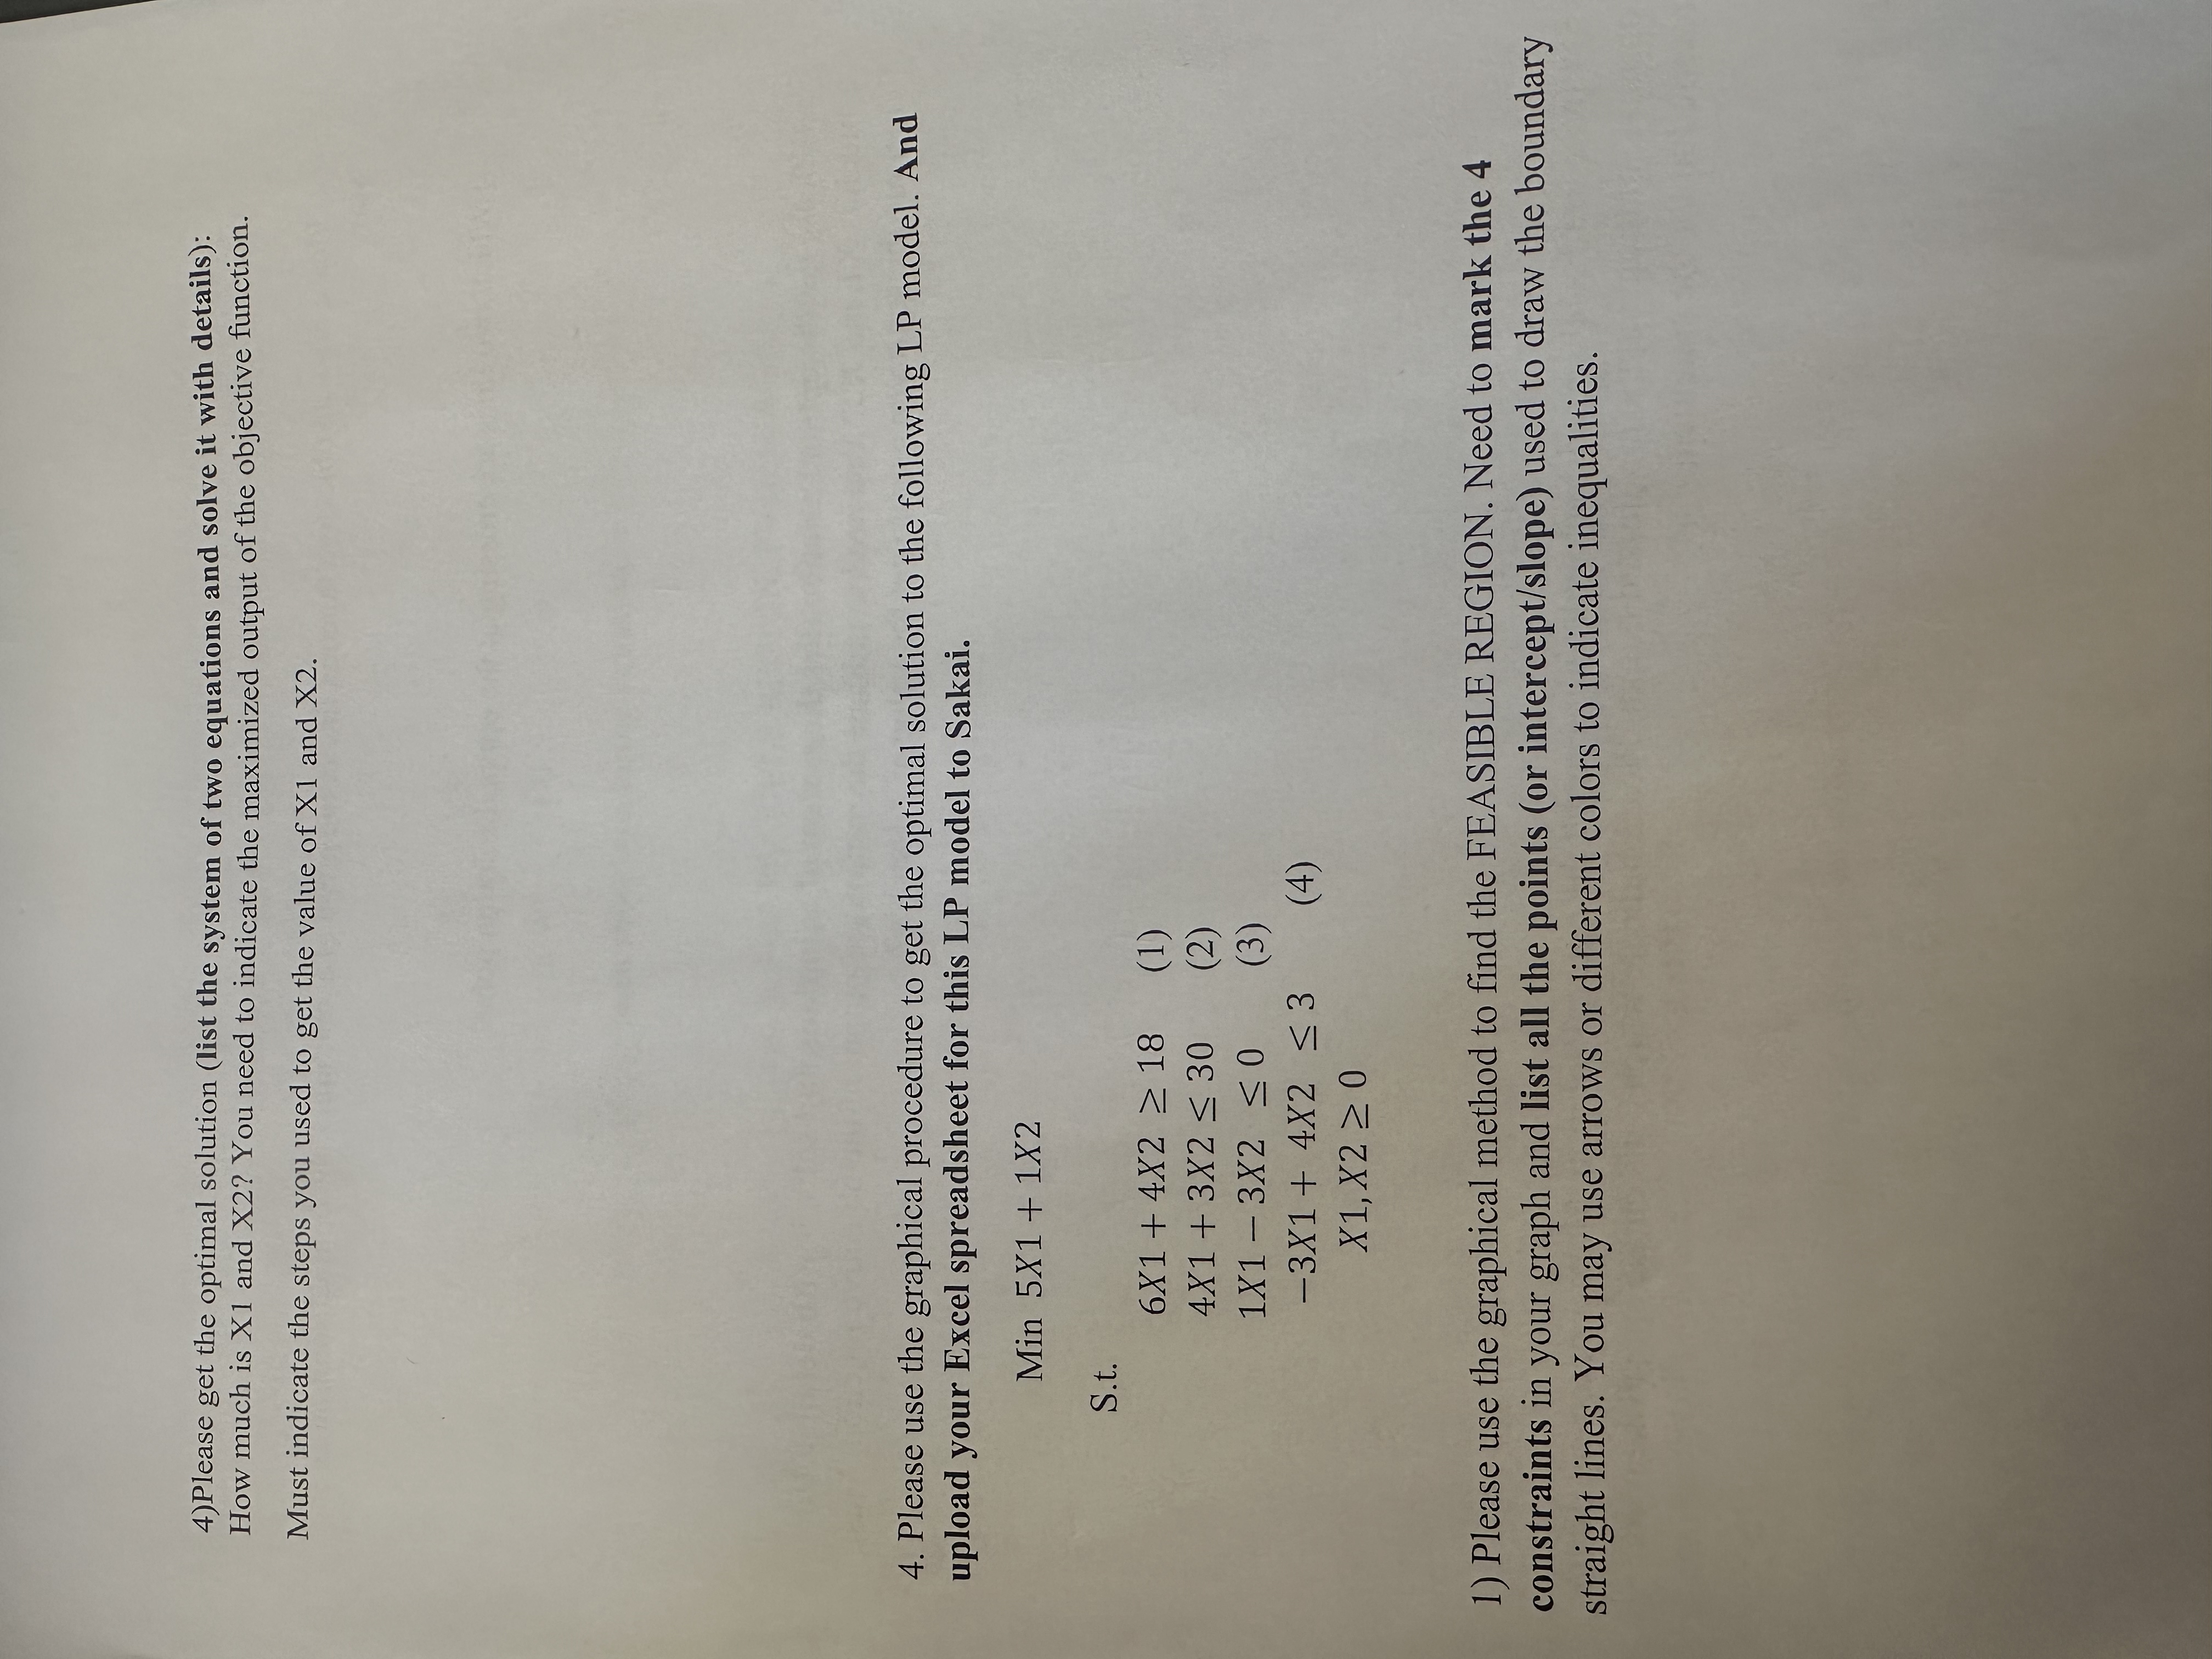
Please get the optimal solution (list the system of two equations and solve it with details): How much is X 1 and X 2 ? You need to indicate the maximized output of the objective function. Must indicate the steps you used to get the value of X1 and X2. 4. Please use the graphical procedure to get the optimal solution to the following LP model. And upload your Excel spreadsheet for this LP model to Sakai.
Min5x1+1x2S.t.
6x1+4x2>=18
4x1+3x2<=30
1x1-3x2<=0
-3x1+4x2<=3
x1,x2>=0
Please use the graphical method to find the FEASIBLE REGION. Need to mark the 4 constraints in your graph and list all the points (or intercept/slope) used to draw the boundary straight lines. You may use arrows or different colors to indicate inequalities.Please draw an objective function line in the graph of a. and mark the optimal solution as a star. Which two lines are crossing at the optimal solution point? Please get the optimal solution (list the system of equations and solve it with details): How much is X1 and X2? You need to indicate the minimized output of the objective function. Must include the steps you used to get the value of X1 and X2. Please use Excel spreadsheet with Solver to get the optimal solution. Make a statement of the optimal solution and the minimized output. Please indicate which cells on the spreadsheet you referred to for the statement.Please use the graphical procedure to get the optimal solution to the following LP model. You may follow the procedure in Practice 3.
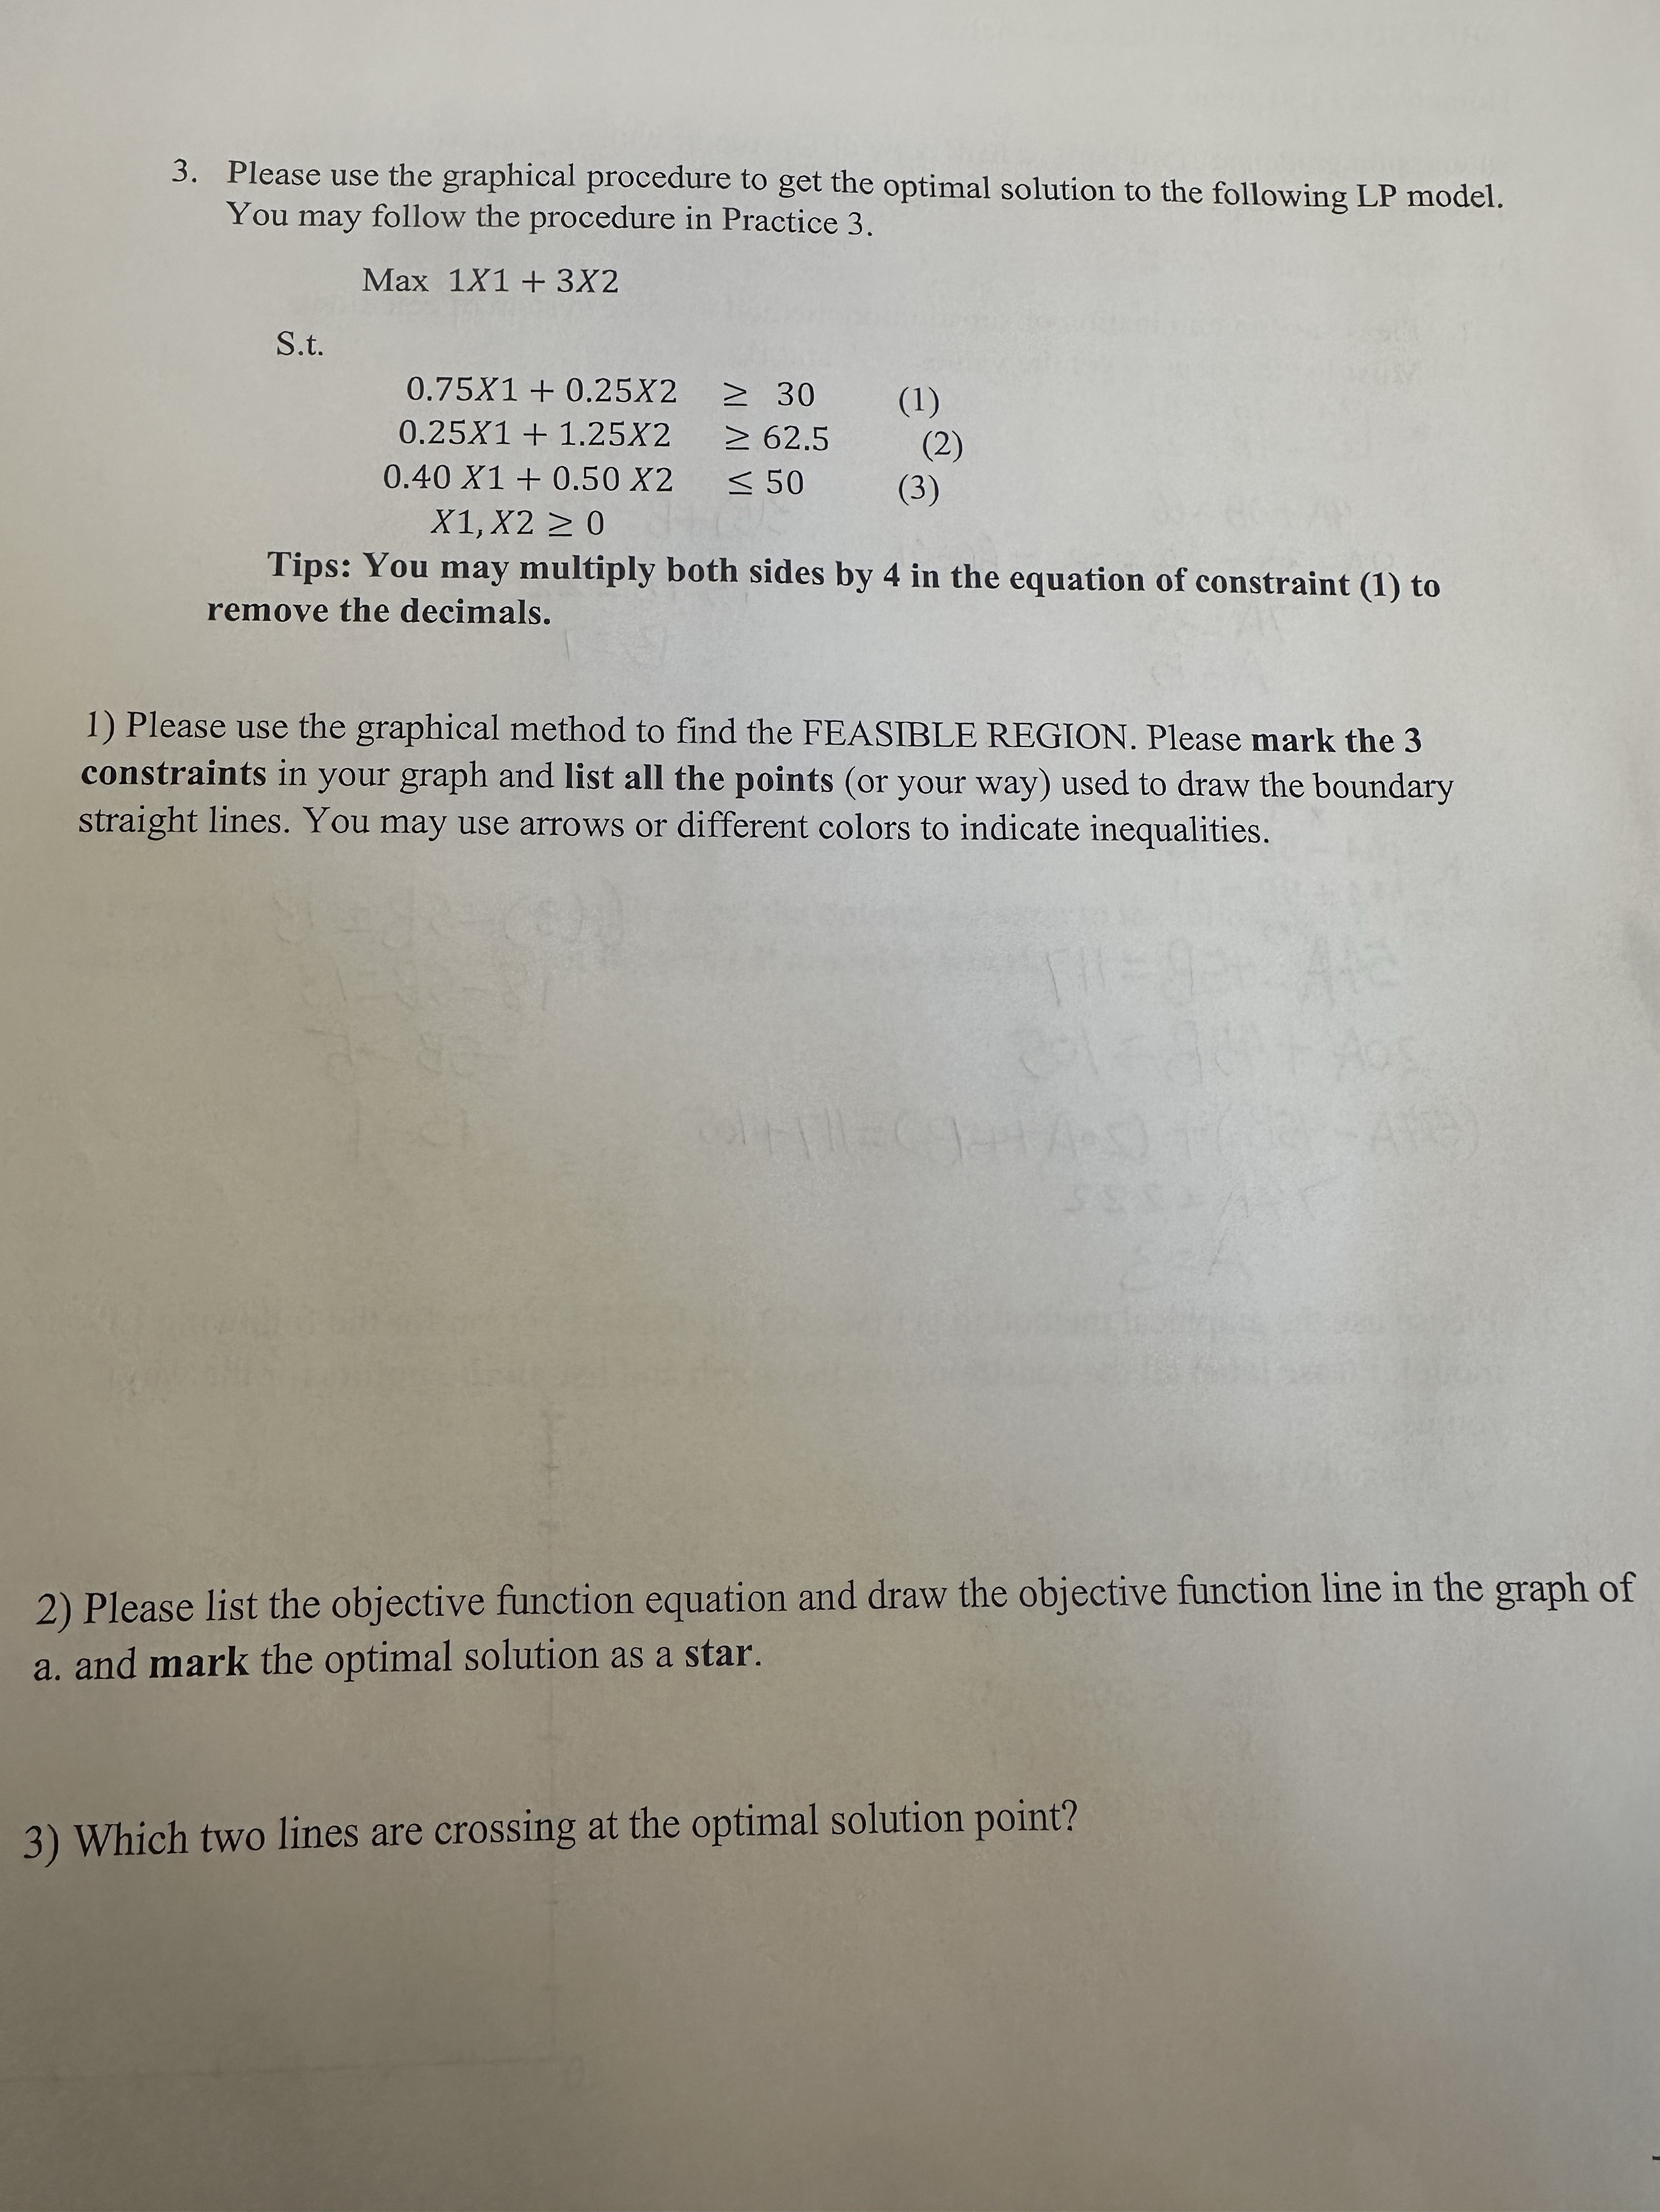
Max1x1+3x2S.t.
0.75x1+0.25x2,>=30
0.25x1+1.25x2,>=62.5
0.40x1+0.50x2,<=50
x1,x2>=0,
Tips: You may multiply both sides by 4 in the equation of constraint (1) to remove the decimals. Please use the graphical method to find the FEASIBLE REGION. Please mark the 3 constraints in your graph and list all the points (or your way) used to draw the boundary straight lines. You may use arrows or different colors to indicate inequalities. Please list the objective function equation and draw the objective function line in the graph of a. and mark the optimal solution as a star. Which two lines are crossing at the optimal solution poin