(Solved): please help me with comapring the two plotting methods, and parts e and f The data in Table 1 be ...
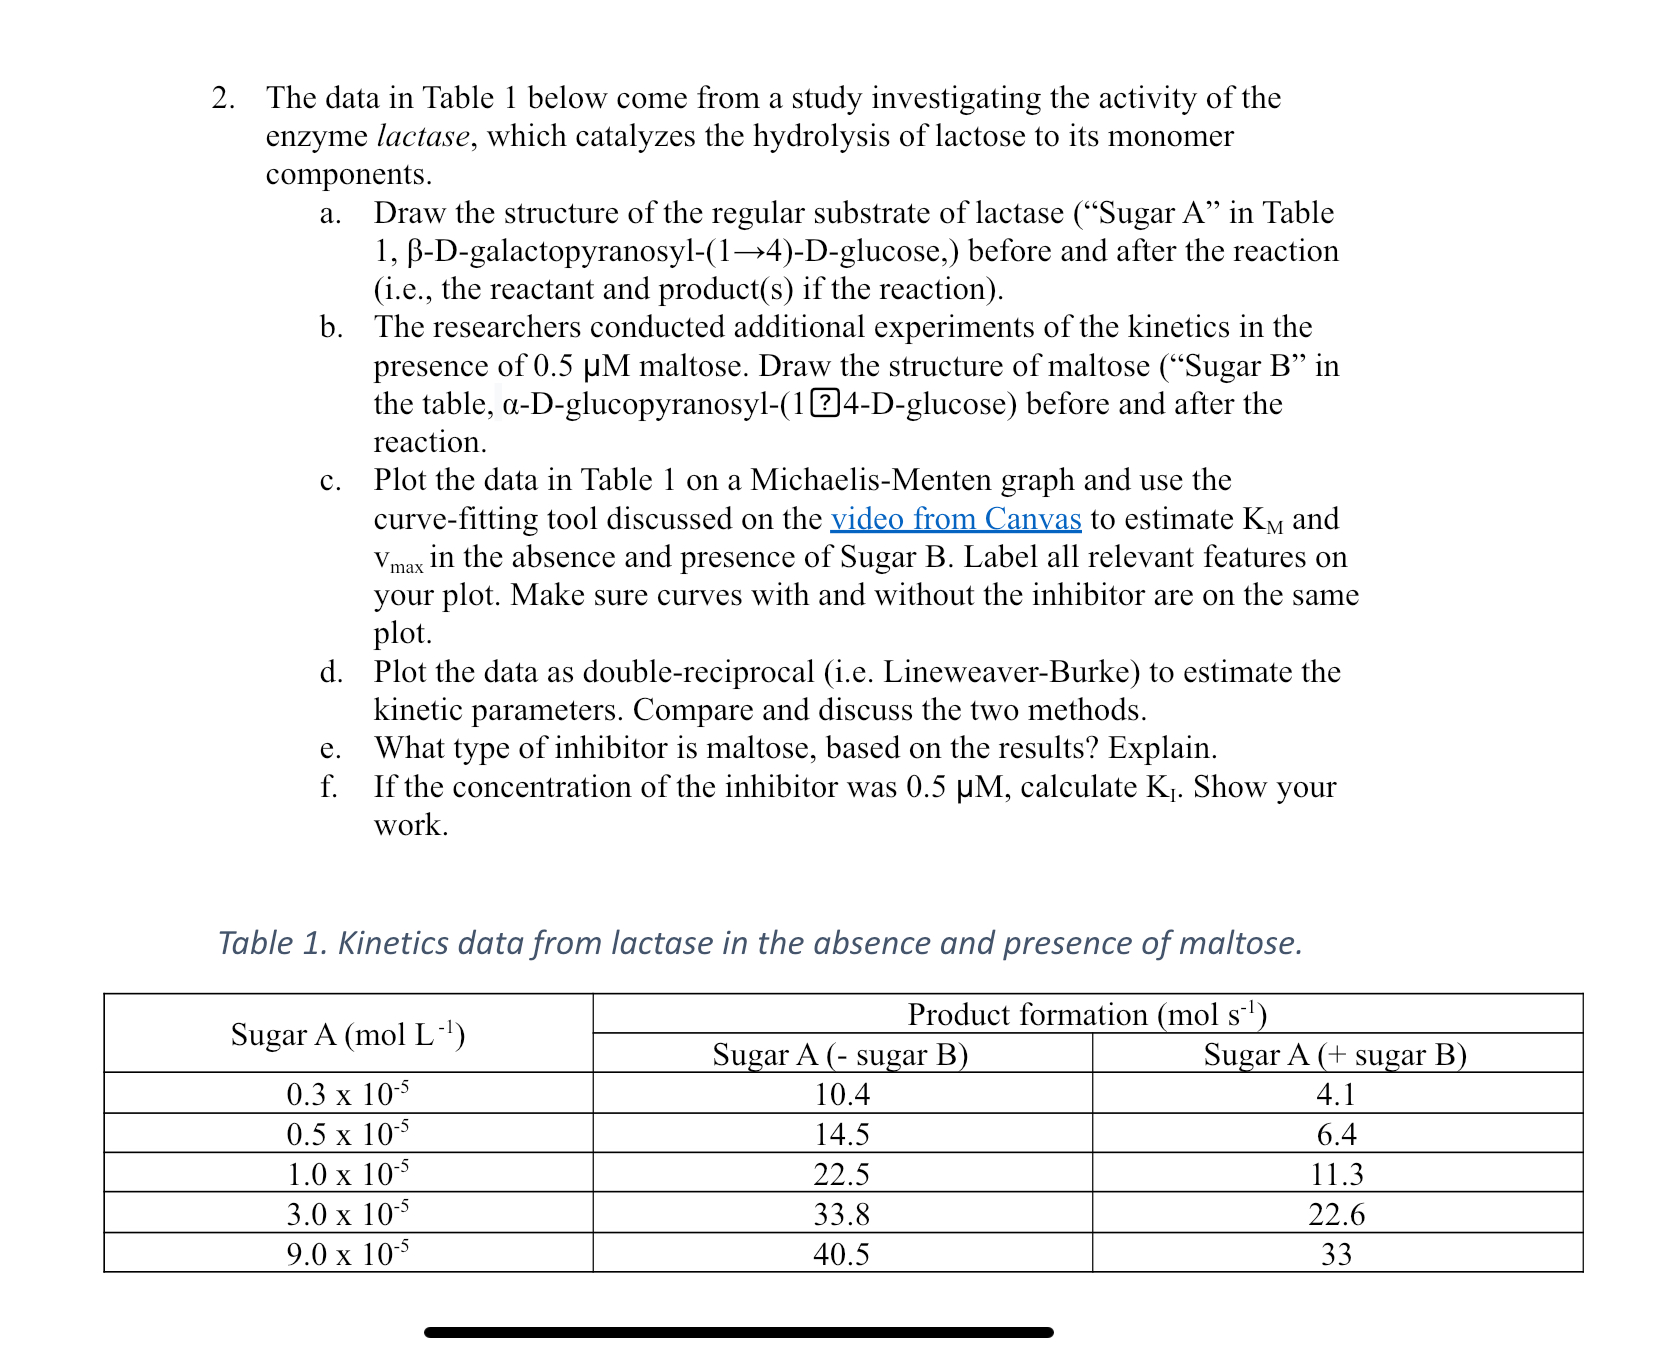
please help me with comapring the two plotting methods, and parts e and f The data in Table 1 below come from a study investigating the activity of the enzyme lactase, which catalyzes the hydrolysis of lactose to its monomer components. c. Plot the data in Table 1 on a Michaelis-Menten graph and use the curve-fitting tool discussed on the video from Canvas to estimate
K_(M)and
v_(max )in the absence and presence of Sugar B. Label all relevant features on your plot. Make sure curves with and without the inhibitor are on the same plot. d. Plot the data as double-reciprocal (i.e. Lineweaver-Burke) to estimate the kinetic parameters. Compare and discuss the two methods. e. What type of inhibitor is maltose, based on the results? Explain. f. If the concentration of the inhibitor was
0.5\mu M, calculate
K_(I). Show your work. Table 1. Kinetics data from lactase in the absence and presence of maltose.