Home /
Expert Answers /
Electrical Engineering /
please-show-matlab-and-explain-dont-copy-others-or-thumbs-down-complete-the-following-1-choose-t-pa670
(Solved): please show matlab and explain. dont copy others or thumbs down Complete the following: 1. Choose t ...
please show matlab and explain. dont copy others or thumbs down
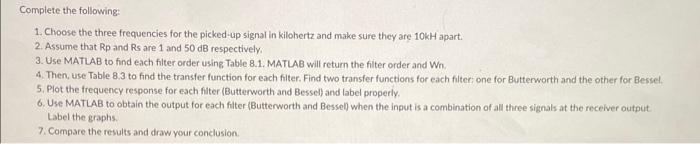
Complete the following: 1. Choose the three frequencies for the picked-up signal in kilohertz and make sure they are apart. 2. Assume that Rp and Rs are 1 and respectively. 3. Use MATLAB to find each filter order using Table 8.1. MATLAB will return the filter order and Wn. 4. Then, use Table to find the transfer function for each fiter. Find two transfer functions for each filtec; one for Butterworth and the other for Bessel. 5. Plot the frequency response for each filter (Butterworth and Bessel) and label properly. 6. Use MATLAB to obtain the output for each fitter (Butterworth and Bessell when the input is a combination of all three signals at the receiver output. Label the graphs. 7. Compare the results and draw your conclusion.
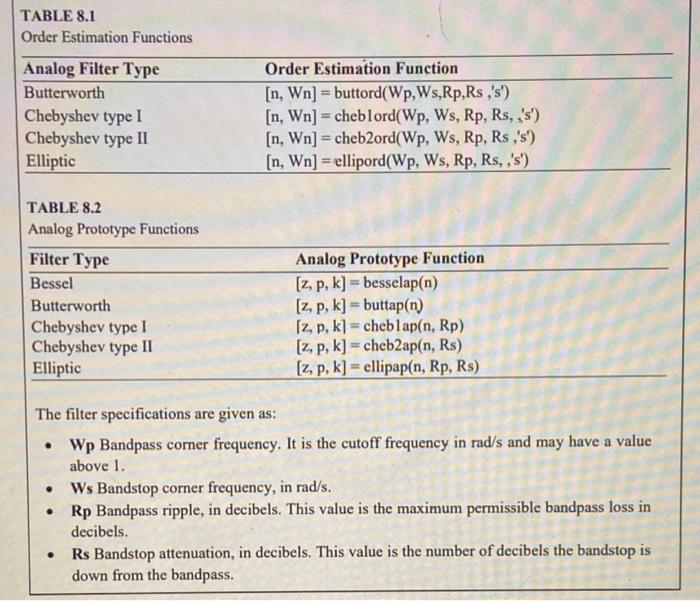
TABLE Order Estimation Functions TABLE Analog Prototype Functions The filter specifications are given as: - Wp Bandpass corner frequency. It is the cutoff frequency in rad/s and may have a value above 1 . - Ws Bandstop corner frequency, in rad/s. - Rp Bandpass ripple, in decibels. This value is the maximum permissible bandpass loss in decibels. - Rs Bandstop attenuation, in decibels. This value is the number of decibels the bandstop is down from the bandpass.