Home /
Expert Answers /
Economics /
problem-2-e-referencing-the-graphs-shown-in-the-above-diagram-which-of-the-following-choices-illu-pa154
(Solved): Problem 2 e: Referencing the graphs shown in the above diagram, which of the following choices illu ...
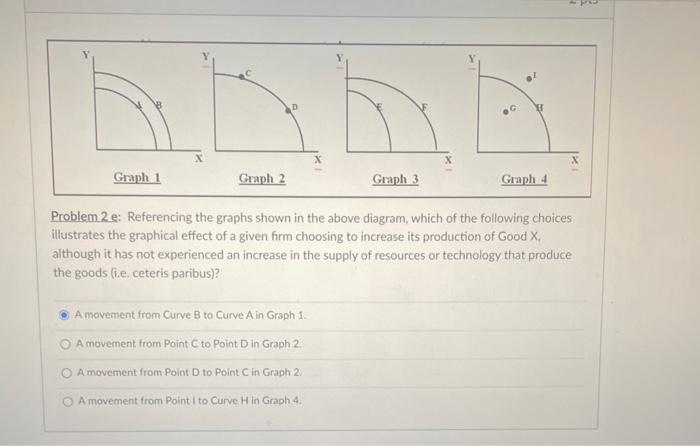
Problem 2 e: Referencing the graphs shown in the above diagram, which of the following choices illustrates the graphical effect of a given firm choosing to increase its production of Good \( X \). although it has not experienced an increase in the supply of resources or technology that produce the goods (i.e, ceteris paribus)? A movement from Curve B to Curve A in Graph 1. A movement from Point \( C \) to Point \( D \) in Graph 2. A movement from Point \( D \) to Point \( C \) in Graph 2. A movement from Point I to Curve \( \mathrm{H} \) in Graph 4.
Expert Answer
The impact of a given firm choosing to expand the