Home /
Expert Answers /
Advanced Math /
q-2-the-data-in-the-table-is-from-a-study-reported-in-2-relating-rate-of-oxygen-consumption-r-t-pa616
(Solved): Q 2. The data in the table is from a study (reported in [2]) relating rate of oxygen consumption R t ...
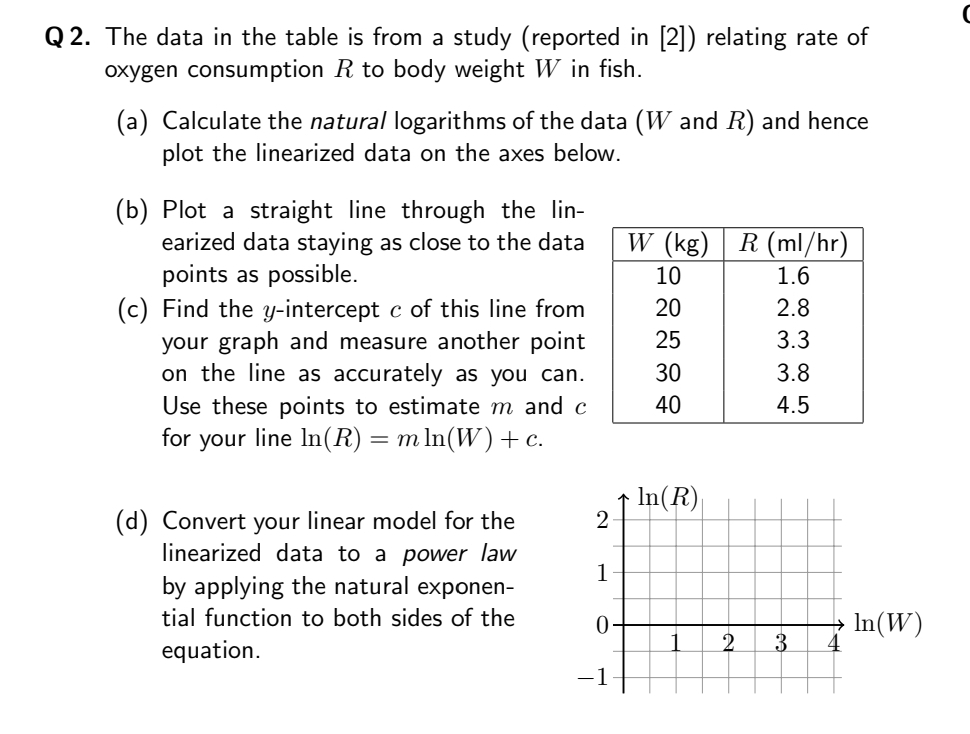
Q 2. The data in the table is from a study (reported in [2]) relating rate of oxygen consumption
Rto body weight
Win fish. (a) Calculate the natural logarithms of the data (
Wand
R) and hence plot the linearized data on the axes below. (b) Plot a straight line through the linearized data staying as close to the data points as possible. (c) Find the
y-intercept
cof this line from your graph and measure another point on the line as accurately as you can. Use these points to estimate
mand
c\table[[
W(kg),
R(m(l)/(h)r)