(Solved): Q1 (a) Table Q1.1 shows traffic noise level (in decibel, dB) at Jalan Kluang captured over the wee ...
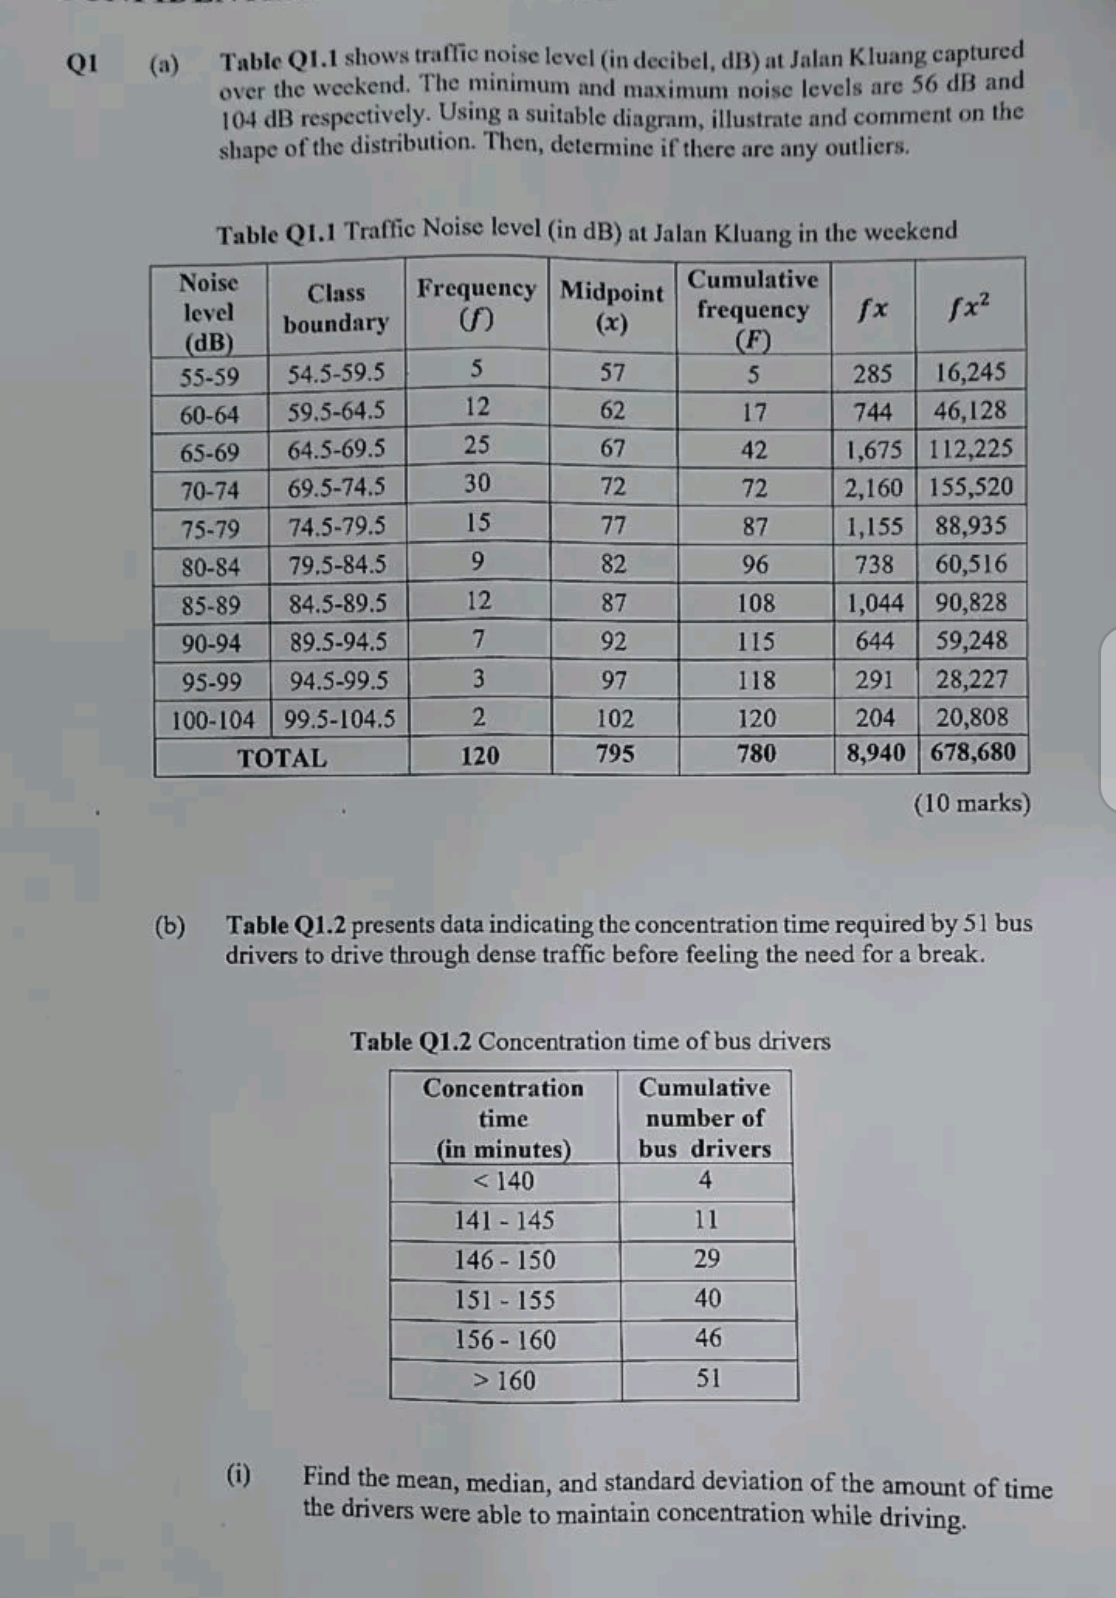
Q1 (a) Table Q1.1 shows traffic noise level (in decibel, dB) at Jalan Kluang captured over the weekend. The minimum and maximum noise levels are
56dBand
104dBrespectively. Using a suitable diagram, illustrate and comment on the shape of the distribution. Then, determine if there are any outliers. Table Q1.1 Traffic Noise level (in
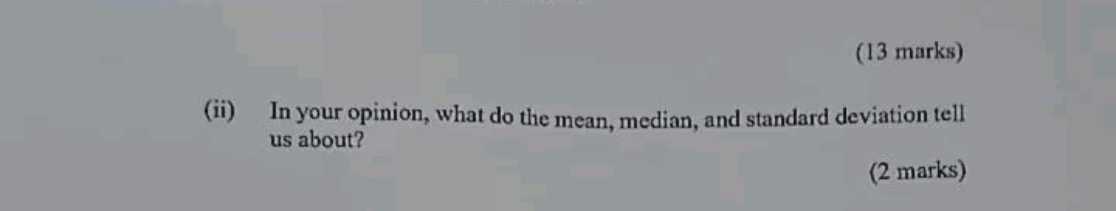
dB) at Jalan Kluang in the weekend \table[[\table[[Noise],[level],[( dB )]],\table[[Class],[boundary]],\table[[Frequency],[(f)]],\table[[Midpoint],[(x)]],\table[[Cumulative],[frequency],[(F)]],fx,fx^(2)],[55-59,54.5-59.5,5,57,5,285,16,245],[60-64,59.5-64.5,12,62,17,744,46,128],[65-69,64.5-69.5,25,67,42,1,675,112,225],[70-74,69.5-74.5,30,72,72,2,160,155,520],[75-79,74.5-79.5,15,77,87,1,155,88,935],[80-84,79.5-84.5,9,82,96,738,60,516],[85-89,84.5-89.5,12,87,108,1,044,90,828],[90-94,89.5-94.5,7,92,115,644,59,248],[95-99,94.5-99.5,3,97,118,291,28,227],[100-104,99.5-104.5,2,102,120,204,20,808],[TOTAL,120,795,780,8,940,678,680]] ( 10 marks) (b) Table Q1.2 presents data indicating the concentration time required by 51 bus drivers to drive through dense traffic before feeling the need for a break. Table Q1.2 Concentration time of bus drivers (i) Find the mean, median, and standard deviation of the amount of time the drivers were able to maintain concentration while driving. (ii) In your opinion, what do the mean, median, and standard deviation tell us about? (2 marks)help