Home /
Expert Answers /
Computer Science /
question-2-python-nbsp-lesson-matplotlibprint-sc-sys-ra-asertcreate-three-sets-of-lines-with-the-num-pa483
(Solved): Question 2 PYTHON Lesson MatplotLibPrint Sc(SyS Ra)asertCreate three sets of lines with the num ...
Question 2 PYTHON
Lesson MatplotLib
Print Sc
(SyS Ra)
asert
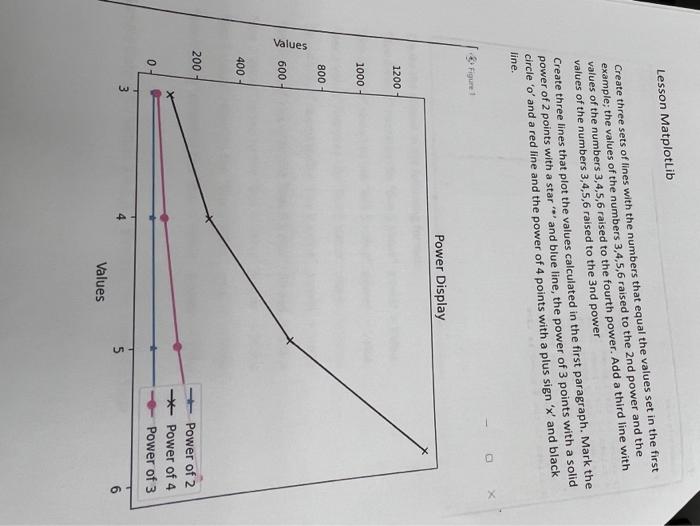
Create three sets of lines with the numbers that equal the values set in the first
example; the values of the numbers 3,4,5,6 raised to the 2nd power and the
values of the numbers 3,4,5, 6 raised to the fourth power. Add a third line with
values of the numbers 3,4,5,6 raised to the 3nd power
Create three lines that plot the values calculated in the first paragraph. Mark the
power of 2 points with a star **' and blue line, the power of 3 points with a solid
circle 'o' and a red line and the power of 4 points with a plus sign 'x' and black
line.
Lesson MatplotLib Create three sets of lines with the numbers that equal the values set in the first example; the values of the numbers \( 3,4,5,6 \) raised to the 2 nd power and the values of the numbers \( 3,4,5,6 \) raised to the fourth power. Add a third line with values of the numbers 3,4,5,6 raised to the 3 nd power Create three lines that plot the values calculated in the first paragraph. Mark the power of 2 points with a star '"' and blue line, the power of 3 points with a solid circle ' \( o \) ' and a red line and the power of 4 points with a plus sign ' \( x \) ' and black line.