Home /
Expert Answers /
Economics /
question-3-5-figure-2-3-shows-the-supply-and-demand-curves-for-ferry-services-around-manhattan-ima-pa448
(Solved): Question 3.5 Figure 2.3 shows the supply and demand curves for ferry services around Manhattan. Ima ...
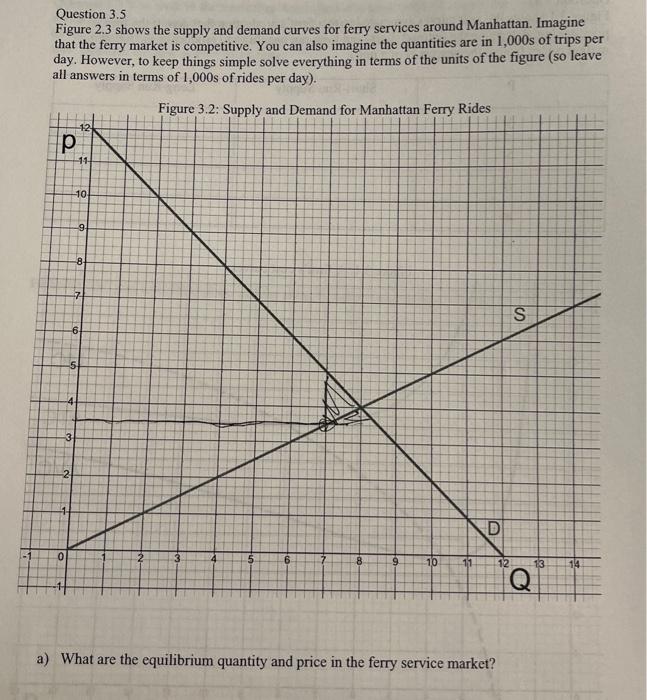
Question 3.5 Figure 2.3 shows the supply and demand curves for ferry services around Manhattan. Imagine that the ferry market is competitive. You can also imagine the quantities are in 1,000s of trips per day. However, to keep things simple solve everything in terms of the units of the figure (so leave all answers in terms of 1,000 s of rides per day). a) What are the equilibrium quantity and price in the ferry service market?
c) A local economist argues that ferry traffic generates a negative externality and estimates the marginal social cost of another 1,000 ferry trips per day as . Explain in a sentence or two why ferry traffic may generate an externality. d) A friend overhears your discussion with the economist and proposes a price ceiling may be a good way to improve the total surplus generated by the Manhattan Ferry market. What price ceiling would be required to reach the socially optimal allocation of Manhattan Ferry rides?
Expert Answer
a) The figure shows the supply and demand schedule for ferry services.We can infer equilibrium in this market which is the intersection point of the supply and demand curve.The equilibrium is the market condition where demanded quantity is equal to the supplied quantity.The equilibrium quantity is 8000 trips and the equilibrium price is $4.