Home /
Expert Answers /
Statistics and Probability /
question-4-a-group-of-grape-juice-enthusiasts-tested-taste-of-grape-juice-from-south-america-the-pa601
(Solved): Question 4: A group of grape juice enthusiasts tested taste of grape juice from South America. The ...
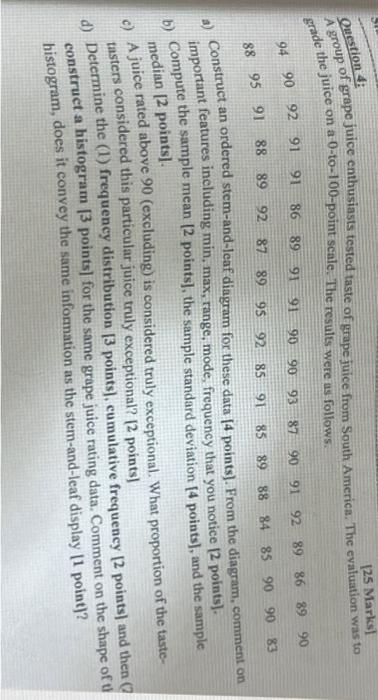
Question 4: A group of grape juice enthusiasts tested taste of grape juice from South America. The evaluation was to grid the juice on a 0 -to-100-point scale. The results were as follows. a) Construct an ordered stem-and-leaf diagram for these data points]. From the diagram, comment on important features including min, max, range, mode, frequency that you notice points]. b) Compute the sample mean points], the sample standard deviation points], and the sample median [2 points]. c) A juice rated above 90 (excluding) is considered truly exceptional. What proportion of the tastetasters considered this particular juice truly exceptional? [2 points] d) Determine the (1) frequency distribution [3 points], cumulative frequency points] and then (2 construet a histogram points] for the same grape juice rating data. Comment on the shape of histogram, does it convey the same information as the stem-and-leaf display [1 point]?