Home /
Expert Answers /
Computer Science /
questions-3-3-1-discuss-the-six-different-output-values-that-are-provided-by-a-pivot-grid-3-2-t-pa767
(Solved): Questions 3: 3.1. Discuss the six different output values that are provided by a Pivot Grid. 3.2. T ...
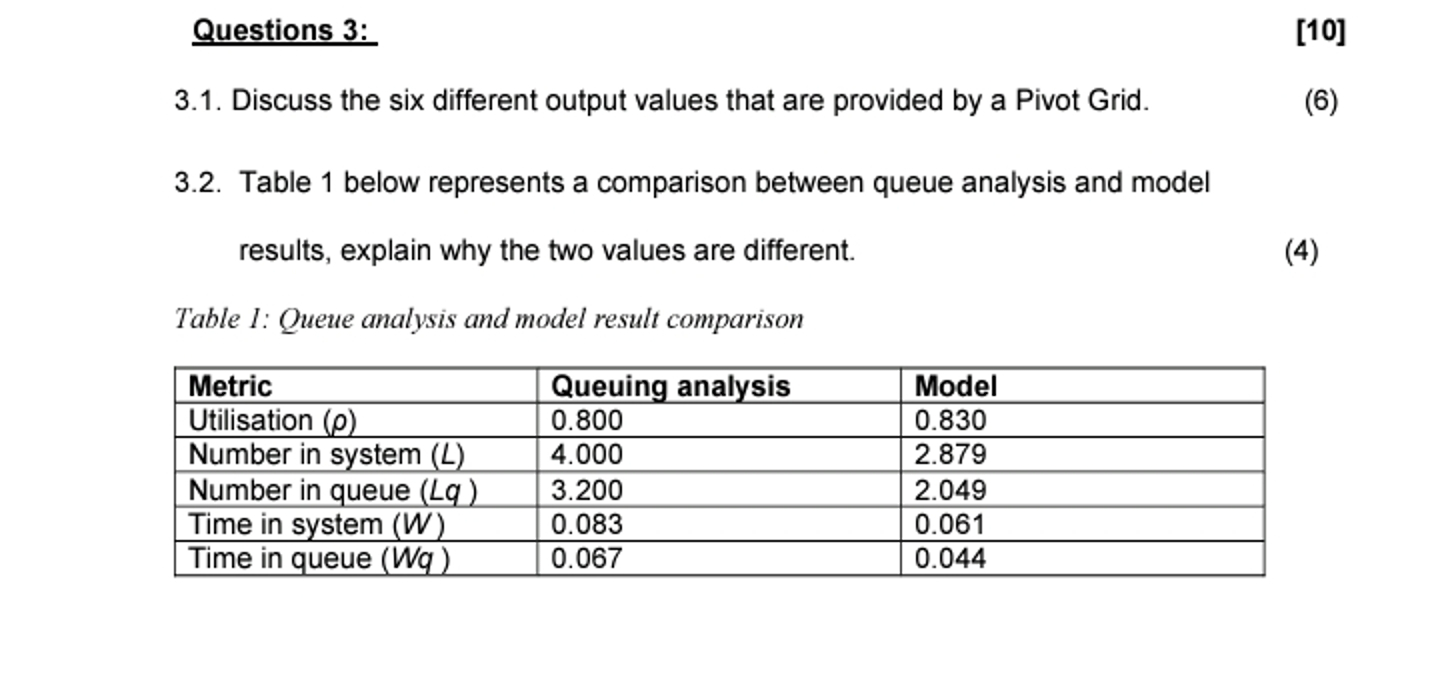
Questions 3: 3.1. Discuss the six different output values that are provided by a Pivot Grid. 3.2. Table 1 below represents a comparison between queue analysis and model results, explain why the two values are different. Table 1: Queue analysis and model result comparison