Home /
Expert Answers /
Statistics and Probability /
r-varies-from-the-coefficient-of-determination-varies-from-the-first-response-goes-in-the-fi-pa653
(Solved): \( r \) varies from the coefficient of determination varies from The first response goes in the fi ...
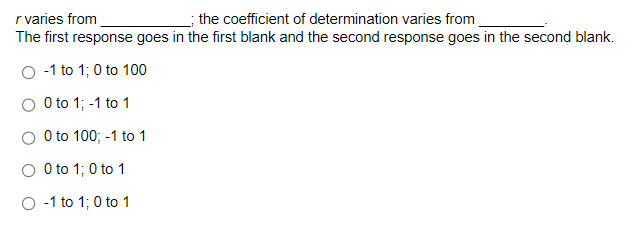
\( r \) varies from the coefficient of determination varies from The first response goes in the first blank and the second response goes in the second blank. \( r \) varies from The first response goes in the first \( -1 \) to \( 1 ; 0 \) to 100 0 to \( 1 ;-1 \) to 1 0 to \( 100 ;-1 \) to 1 0 to \( 1 ; 0 \) to 1 \( -1 \) to \( 1 ; 0 \) to 1
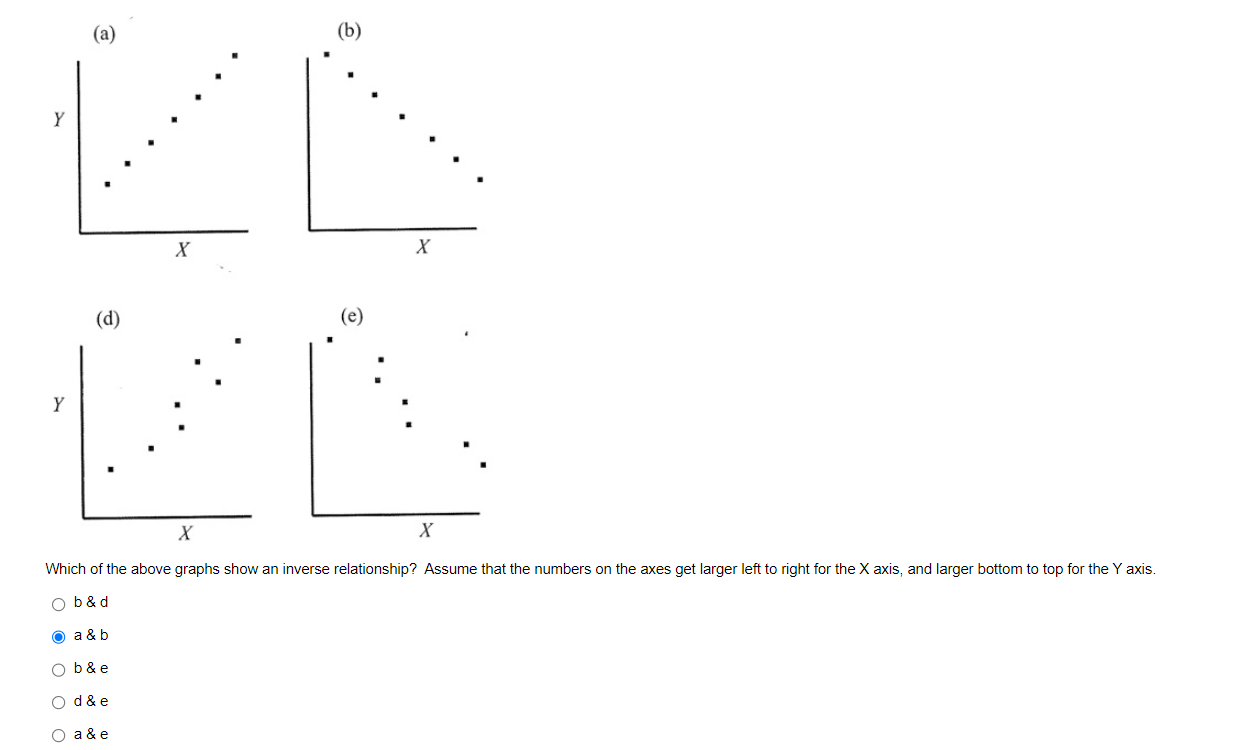
Which of the above graphs show an inverse relationship? Assume that the numbers on the axes get larger left to right for the \( \mathrm{X} \) axis, and larger bottom to top for the \( \mathrm{Y} \) axis. \( b \& d \) \( a \& b \) \( \mathrm{b} \& \mathrm{e} \) \( d \& e \) \( a \& \mathrm{e} \)
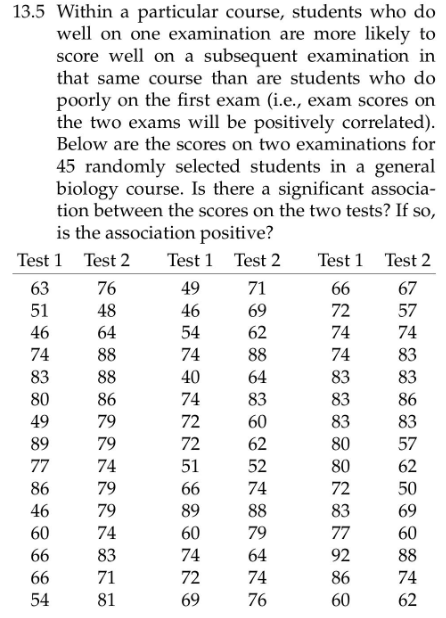
13.5 Within a particular course, students who do well on one examination are more likely to score well on a subsequent examination in that same course than are students who do poorly on the first exam (i.e., exam scores on the two exams will be positively correlated). Below are the scores on two examinations for 45 randomly selected students in a general biology course. Is there a significant association between the scores on the two tests? If so, is the association positive?
Expert Answer
Part 1: r varies from from -1 to 1; the coefficient of determination varies from