Home /
Expert Answers /
Mechanical Engineering /
read-the-following-article-and-describe-in-details-the-synthesis-of-the-nanosilicon-coated-gra-pa245
(Solved): Read the following article and describe in details the synthesis of the nanosilicon-coated gra ...
Read the following article and describe in details the synthesis of the nanosilicon-coated graphene granules for the Li-ion batteries anode application.
Increased concern regarding environmental pollution from com- bustion power sources combined with the shortage of oil reserves and the growing demand for portable electronics and powered devices has generated considerable research activity to develop Li-ion batteries with greatly enhanced energy density. Histori- cally, the Li-ion anode has been composed of graphitic carbon. At full lithiation, graphite can intercalate one Li atom per six carbon atoms (LiC) for a theoretical capacity of 372 mAh-g-¹.121 Substituting graphene for graphite to increase the number of lithiation sites and gain higher capacity has been explored.[3] The common shortcomings of graphene-based anodes include very high irreversible capacity losses at the first cycle, low Cou- lombic efficiency (CE) in subsequent cycles and limited overall stability caused by the separation of graphene layers, which make graphene unsuitable as a replacement to the current graphite anode technology. Composite electrodes consisting of graphene nanosheets and carbon nanotubes and/or fullerenes have shown to increase discharge capacity but failed to improve its stability to industrially useful levels. B The application of elements that electrochemically alloy with Li at room temperature offers an alternative solution to the high capacity anode demand.14 Si has received particular attention due to its highest gravimetric capacity for Li.[5] The challenge to achieve a stable performance of the Li alloying elements originates from the large volume changes occurring during the Li insertion/extraction processes. The Li-Si system can expand/contract during alloying/dealloying by as much as 300% by volume after forming Li?5Si4 with a theoret- ical capacity of 3579 mAh-g-¹.16 These cyclical volume changes can generate stresses in the electrode material, forming cracks and breaks in electrical conductivity.[8] In addition, conventional battery construction cannot accommodate electrode volume changes in excess of 6-8%. The use of Si nanoparticles, often combined with a high binder and C additive content,[55] may overcome some of these limitations at the expense of lowering the volumetric capacity. To mitigate the detrimental effects of volume changes in Si, much effort has been undertaken to produce composite K. Evanoff, Dr. A. Magasinski, Prof. G. Yushin School of Materials Science and Engineering Georgia Institute of Technology 771 Ferst Drive, Atlanta, GA 30332-0245, USA E-mail: yushin@gatech.edu Dr. J. Yang Chemical Sciences & Engineering Division Argonne National Laboratory 9700 S. Cass Avenue Argonne II 60439 LISA electrodes consisting of a high capacity material and various carbons at the nanoscale.[4b,5g.51.9] Early Si-C composite elec- trodes were mostly fabricated by the decomposition of C- and Si containing precursors or through mechanical mixing and have not exhibited acceptable performancel9b, 101 due to limited porosity available for Si volume changes and non-uniform material properties at the nanoscale. Recent work has demon- strated that significantly better performance could be achieved if the composite materials contain uniformly distributed Si, C, and interconnected pores. Isa.Se 5g. 51,9f,9gl Several studies analyzed the performance of graphene mixed with high capacity nanoparticles of Snl or Sil¹1 using phys- ical mixing or solution-based methods. In spite of the notice- able improvements over the pure graphene performance, these studies demonstrated several shortcomings. The high surface area led to very large irreversible capacity losses and low CE at the first (<73%) and the subsequent 30 cycles (80-94%). The anode stability was moderate with -30% losses during the first 30-100 cycles. In the case of Sn, the capacity improve- ments were also moderate, -500 mAh-g¹ after 100 cycles[?], only a slight increase beyond theoretical capacity for graphite and less than the proposed theoretical capacity of graphene (744 mAh-g-¹). Here, we present an alternative method to synthesize porous nanosilicon and graphene-containing nanocomposites with the specific Li extraction capacity in excess of 2000 mAh.g-¹ and stable performance for over 150 cycles. In contrast to prior work on graphene mixed with Sil¹¹1, we employ vapor deposi- tion methods in our synthesis, which allowed us to reduce the graphene surface area by over 100 times and achieve an average CE in excess of 99%. In contrast to prior work on Si nanopar- ticles deposited on carbon black or graphite99d9el, we study continuous Si films conformally deposited on the graphene sheets, a feature not previously found in the literature. The proposed synthesis route and the developed architecture of three-dimensional (3D) porous particles composed of curved two-dimensional (2D) nano-sized layers may provide unique benefits. The prior work on thin film batteries[¹2] showed that during Li insertion large area Si films mostly accommodate the volume changes via variation in thickness. Therefore, the changes in the external surface area during cycling can be min- imized and, thus, formation of a stable solid electrolyte inter- phase (SEI) should be easier to achieve than in Si nanoparti- cles or nanowires, which experience very large external surface area changes during insertion/extraction of Li. Additionally, the high specific surface area of graphene allows rapid Si deposi- tion, which is important for practical applications. Finally, the tunable spacing between individual graphene layers permits
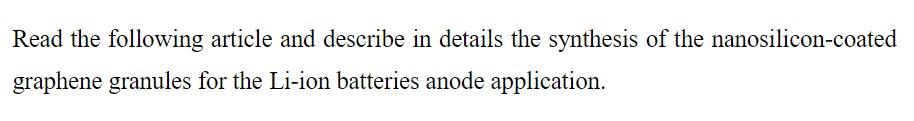
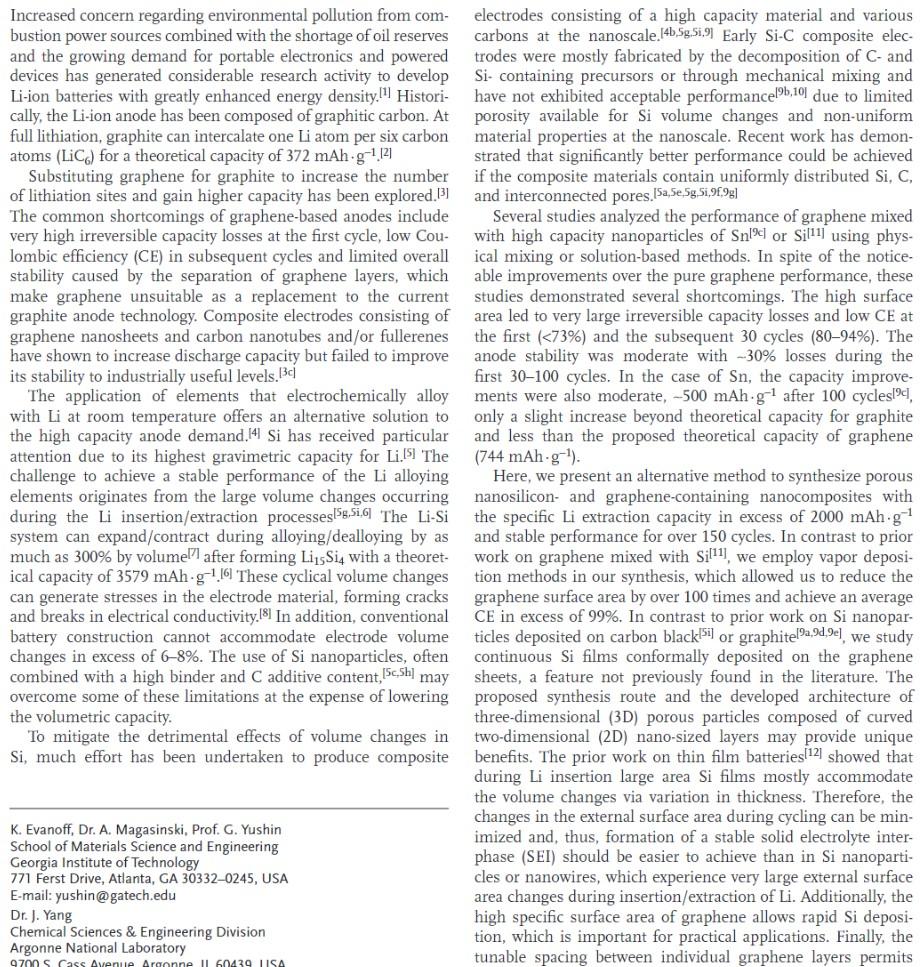
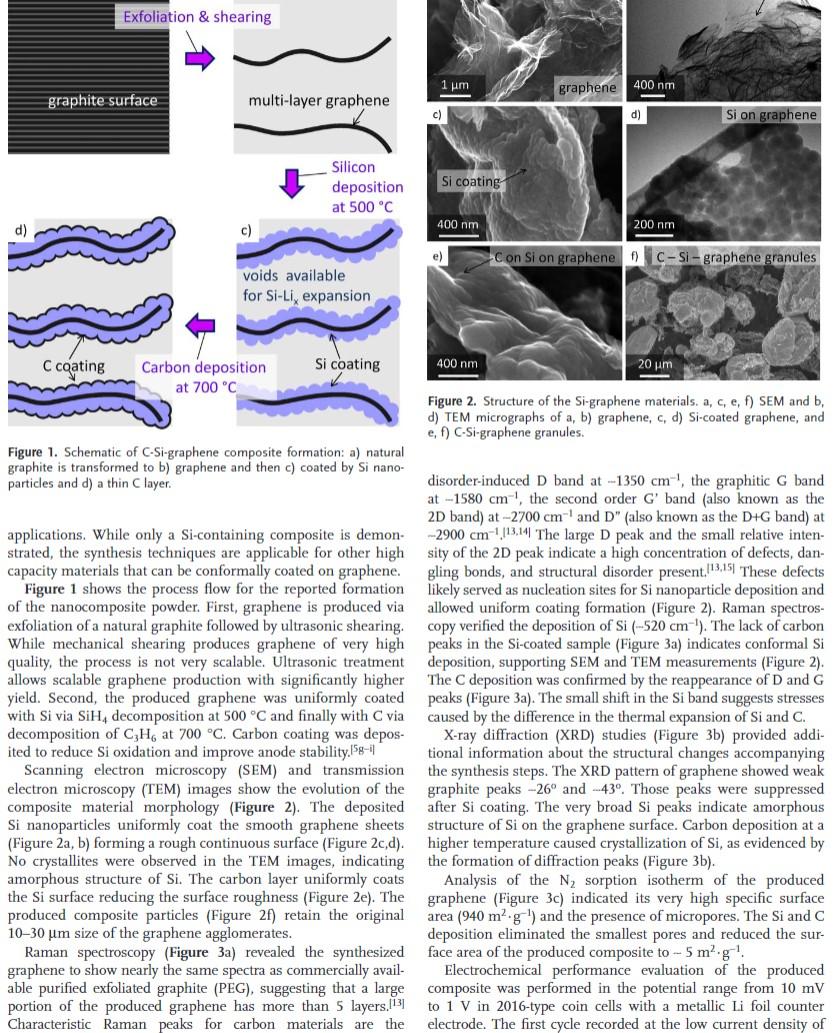
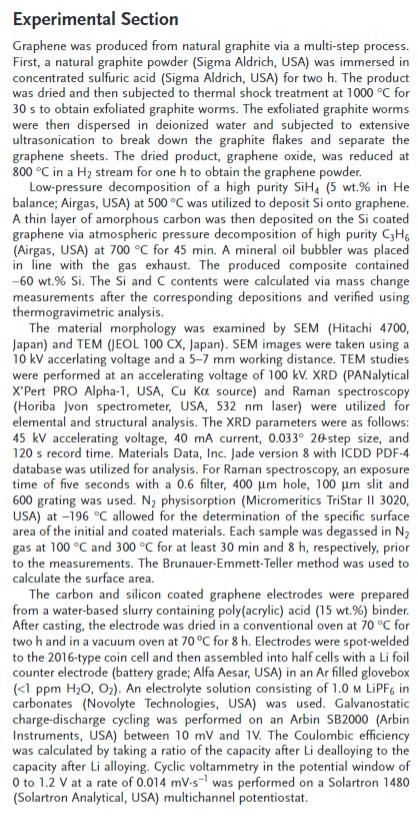
Exfoliation & shearing d) multi-layer graphene Silicon deposition at 500 °C c) voids available for Si-Li, expansion C coating Si coating Carbon deposition at 700 °C Figure 1. Schematic of C-Si-graphene composite formation: a) natural graphite is transformed to b) graphene and then c) coated by Si nano- particles and d) a thin C layer. applications. While only a Si-containing composite is demon- strated, the synthesis techniques are applicable for other high capacity materials that can be conformally coated on graphene. Figure 1 shows the process flow for the reported formation of the nanocomposite powder. First, graphene is produced via exfoliation of a natural graphite followed by ultrasonic shearing. While mechanical shearing produces graphene of very high quality, the process is not very scalable. Ultrasonic treatment. allows scalable graphene production with significantly higher yield. Second, the produced graphene was uniformly coated with Si via SiH, decomposition at 500 °C and finally with C via decomposition of C3H, at 700 °C. Carbon coating was depos- ited to reduce Si oxidation and improve anode stability.5g-i Scanning electron microscopy (SEM) and transmission electron microscopy (TEM) images show the evolution of the composite material morphology (Figure 2). The deposited Si nanoparticles uniformly coat the smooth graphene sheets (Figure 2a, b) forming a rough continuous surface (Figure 2c,d). No crystallites were observed in the TEM images, indicating amorphous structure of Si. The carbon layer uniformly coats the Si surface reducing the surface roughness (Figure 2e). The produced composite particles (Figure 2f) retain the original 10-30 um size of the graphene agglomerates. Raman spectroscopy (Figure 3a) revealed the synthesized graphene to show nearly the same spectra as commercially avail- able purified exfoliated graphite (PEG), suggesting that a large portion of the produced graphene has more than 5 layers.[13] Characteristic Raman peaks for carbon materials are the graphite surface 1 ?m c) graphene Si on graphene 200 nm Con Si on graphene f) C-Si-graphene granules 400 nm 20 ?m. Figure 2. Structure of the Si-graphene materials. a, c, e, f) SEM and b, d) TEM micrographs of a, b) graphene, c, d) Si-coated graphene, and e, f) C-Si-graphene granules. disorder-induced D band at -1350 cm, the graphitic G band at -1580 cm¹, the second order G' band (also known as the 2D band) at -2700 cm-¹ and D" (also known as the D+G band) at -2900 cm ¹13.14 The large D peak and the small relative inten- sity of the 2D peak indicate a high concentration of defects, dan- gling bonds, and structural disorder present.13.15 These defects likely served as nucleation sites for Si nanoparticle deposition and allowed uniform coating formation (Figure 2). Raman spectros- copy verified the deposition of Si (-520 cm ). The lack of carbon peaks in the Si-coated sample (Figure 3a) indicates conformal Si deposition, supporting SEM and TEM measurements (Figure 2). The C deposition was confirmed by the reappearance of D and G peaks (Figure 3a). The small shift in the Si band suggests stresses caused by the difference in the thermal expansion of Si and C. X-ray diffraction (XRD) studies (Figure 3b) provided addi- tional information about the structural changes accompanying the synthesis steps. The XRD pattern of graphene showed weak graphite peaks -26° and -43°. Those peaks were suppressed after Si coating. The very broad Si peaks indicate amorphous structure of Si on the graphene surface. Carbon deposition at a higher temperature caused crystallization of Si, as evidenced by the formation of diffraction peaks (Figure 3b). Analysis of the N? sorption isotherm of the produced graphene (Figure 3c) indicated its very high specific surface area (940 m² g ¹) and the presence of micropores. The Si and C deposition eliminated the smallest pores and reduced the sur- face area of the produced composite 5 m².g¹. Electrochemical performance evaluation of the produced composite was performed in the potential range from 10 mV to 1 V in 2016-type coin cells with a metallic Li foil counter electrode. The first cycle recorded at the low current density of Si coating 400 nm. e) 400 nm - d)
Figure 3. Characterization of the graphene and graphene-based materials by a) Raman spectroscopy, b) X-ray diffraction and c) N? physisorption. 140 mA g¹ showed a high reversible discharge capacity of -2300 mAh-g¹ (1080 mAh-cc-¹) (Figure 4a). This reversible capacity is over six times greater than the theoretical capacity of graphite, indicating a high degree of Li alloying with Si. Increasing the current density to 1400 mA g¹ resulted in the reduction of the average specific reversible capacity to --1060 mAh-g¹. Stability of the produced electrodes for 150 cycles (Figure 4a) is quite remarkable considering that the Li insertion capacity and the resulting Si expansion were not limited. Another positive attribute of the produced composite is high CE (99%, on average), which is likely due to the low composite surface area (Figure 3c), planar Si geometry and its good cycle stability. The potentials at which Li (de-)alloying occurs were exam- ined by cyclic voltammetry (Figure 4b). Broad lithiation peaks were observed at 0.08 and 0.22 V vs. Li/Lit, consistent with our earlier studies on C-coated Si.il The Li was extracted from Si at 0.49 V. The peak height slightly increased after the second cycle, indicating improved cycling kinetics. Carbon delithiation occurs at potentials lower than Si and corresponding peaks are not evident in the differential capacity curves due to the signif- icantly larger Li capacity of Si. Charge/discharge voltage pro- files (Figure 4c) show transformations in the electrode during cycling. The shapes of the profiles are similar to the profiles previously reported in literature for other Si electrodes. Sil With increasing cycling number the Li extraction profiles become more horizontal and exhibit slightly smaller overpotential, sug- gesting a gradual improvement in the discharge kinetics.[5] In summary, we have demonstrated that uniform Si and C coatings can be deposited on high surface area graphene via vapor decomposition routes. The produced Si and C-coated graphene granules exhibit specific surface area of -5 m².g¹ and an average size of -25 um. The anode composed of the nanocomposite particles exhibited specific capacity in excess of 2000 mAh-g¹ at the current density of 140 mA-g¹ and excel- lent stability for 150 cycles, significantly exceeding the theoret- ical capacity of graphite and graphene. The low surface area of the composite resulted in an average Coulombic efficiency in excess of 99%. The proposed architecture of 3D porous particles composed of curved 2D layers may provide unique benefits for a number of Li alloying materials. The developed fabrication route is suitable to generate other high capacity composite electrodes.
Experimental Section Graphene was produced from natural graphite via a multi-step process. First, a natural graphite powder (Sigma Aldrich, USA) was immersed in concentrated sulfuric acid (Sigma Aldrich, USA) for two h. The product was dried and then subjected to thermal shock treatment at 1000 °C for 30 s to obtain exfoliated graphite worms. The exfoliated graphite worms were then dispersed in deionized water and subjected to extensive ultrasonication to break down the graphite flakes and separate the graphene sheets. The dried product, graphene oxide, was reduced at 800 °C in a H? stream for one h to obtain the graphene powder. Low-pressure decomposition of a high purity SiH, (5 wt.% in He balance; Airgas, USA) at 500 °C was utilized to deposit Si onto graphene. A thin layer of amorphous carbon was then deposited on the Si coated graphene via atmospheric pressure decomposition of high purity C?H6 (Airgas, USA) at 700 °C for 45 min. A mineral oil bubbler was placed in line with the gas exhaust. The produced composite contained -60 wt.% Si. The Si and C contents were calculated via mass change measurements after the corresponding depositions and verified using thermogravimetric analysis. The material morphology was examined by SEM (Hitachi 4700, Japan) and TEM (JEOL 100 CX, Japan). SEM images were taken using a 10 kV accerlating voltage and a 5-7 mm working distance. TEM studies were performed at an accelerating voltage of 100 kV. XRD (PANalytical X'Pert PRO Alpha-1, USA, Cu Ko source) and Raman spectroscopy (Horiba Jvon spectrometer, USA, 532 nm laser) were utilized for elemental and structural analysis. The XRD parameters were as follows: 45 kV accelerating voltage, 40 mA current, 0.033° 20-step size, and 120 s record time. Materials Data, Inc. Jade version 8 with ICDD PDF-4 database was utilized for analysis. For Raman spectroscopy, an exposure time of five seconds with a 0.6 filter, 400 ?m hole, 100 ?m slit and 600 grating was used. Ny physisorption (Micromeritics TriStar II 3020, USA) at -196 °C allowed for the determination of the specific surface area of the initial and coated materials. Each sample was degassed in N? gas at 100 °C and 300 °C for at least 30 min and 8 h, respectively, prior to the measurements. The Brunauer-Emmett-Teller method was used to calculate the surface area. The carbon and silicon coated graphene electrodes were prepared from a water-based slurry containing poly(acrylic) acid (15 wt.%) binder. After casting, the electrode was dried in a conventional oven at 70 °C for two h and in a vacuum oven at 70 °C for 8 h. Electrodes were spot-welded to the 2016-type coin cell and then assembled into half cells with a Li foil counter electrode (battery grade; Alfa Aesar, USA) in an Ar filled glovebox (<1 ppm H?O, O?). An electrolyte solution consisting of 1.0 M LiPF6 in carbonates (Novolyte Technologies, USA) was used. Galvanostatic charge-discharge cycling was performed on an Arbin SB2000 (Arbin Instruments, USA) between 10 mV and 1V. The Coulombic efficiency was calculated by taking a ratio of the capacity after Li dealloying to the capacity after Li alloying. Cyclic voltammetry in the potential window of 0 to 1.2 V at a rate of 0.014 mV-s-¹ was performed on a Solartron 1480 (Solartron Analytical, USA) multichannel potentiostat.