Home /
Expert Answers /
Other Math /
researchers-wish-to-study-the-relationship-between-levels-of-credit-card-debt-in-the-adult-populati-pa525
(Solved): Researchers wish to study the relationship between levels of credit card debt in the adult populati ...
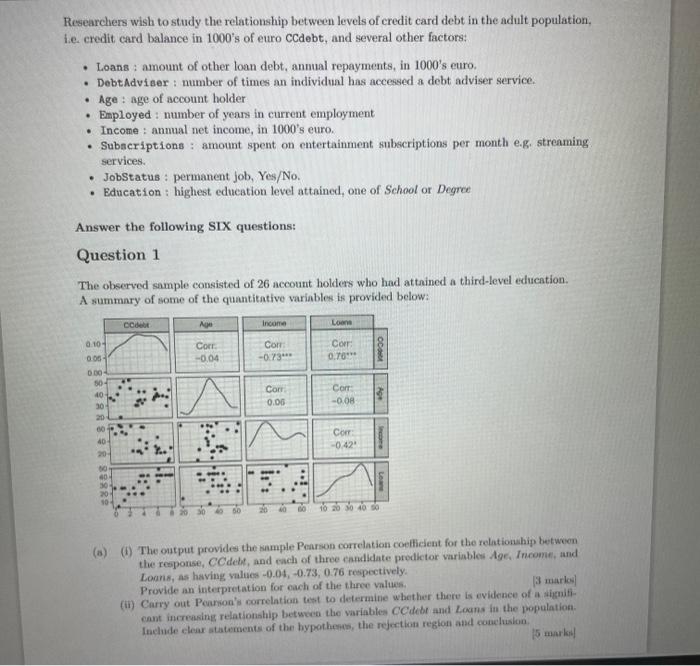
Researchers wish to study the relationship between levels of credit card debt in the adult population, f.e. credit card balance in 's of euro ccdebt, and several other factors: - Loans : amount of other loan debt, annual repayments, in 1000 's euro. - Debtadvieer : number of times an individual has accessed a debt adviser service. - Age : age of account holder - Employed : number of years in current employment - Income : annual net income, in 1000's euro. - Subscriptions : amount spent on entertainment subscriptions per month e.g. streaming services. - JobStatus : permanent job, Yes/No. - Education : highest education level attained, one of School or Degree Answer the following SIX questions: Question 1 The observed sample consisted of 26 account holders who had attained a third-level education. A summary of some of the quantitative variables is provided below: (s) (i) The output provides the sample Pearson correlation coefficient for the relationaip betweon the response, CCdebs, and each of three eandidate predictor variables Age, Inoome, and Loons, as having values respectively. Provide an interpretation for each of the three values. [3 mation (ii) Carry out Pounon's correlation test to determine whether there is evidence of a afgnitcant increasing relationship between the variables CCdebt and Loans in the population. fretude elear statements of the bypotheses, the rejection region and couclusho. 15 ruarkit
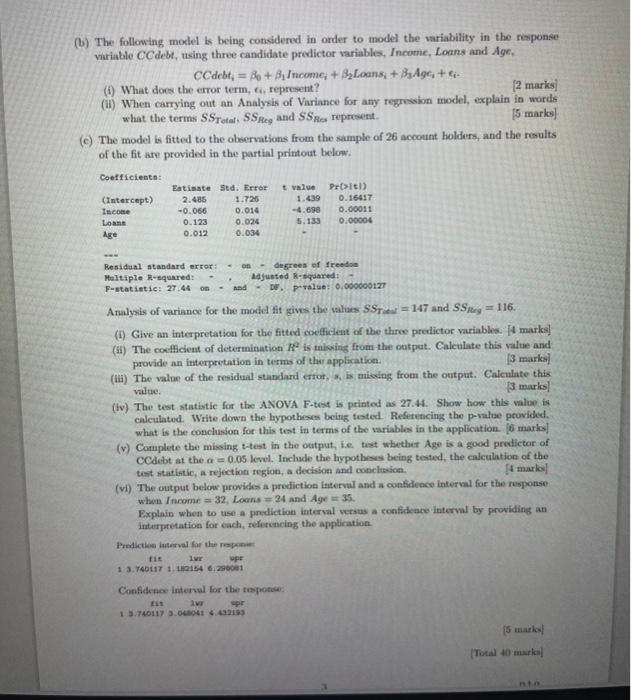
(b) The following model is being considered in order to model the variability in the response variable CCdebt, using three candidate predictor variables, Income, Loans and Age, (i) What does the error term, , represent? [2 marks] (ii) When carrying out an Analysis of Variance for any regrossion model, explain in words what the terms and represent. [5 marks] (c) The model is fitted to the observations from the sample of 26 account holders, and the results of the fit are provided in the partial printout below. Residual atandard error: - on - degrees ef freedoa Maltiple F-squared: - . Adjuttod R-squared: - Analysis of variance for the model fit gives the values and . (i) Give an interpretation for the fitted coeficient of the three predictor variables: marks] (ii) The coefficient of deternination is missing from the output. Calculate this value and provide an interpretation in terms of ther application. [3 marks] (ii) The value of the residual standard erfor, , is mitaing from the output. Calculate this valiue. [3 marks] (iv) The test statistic for the ANOVA F-test is printed as 27.44. Show how this value is calculated. Write down the hypotheses being toted. Referencing the p-value ptovided. what is the conclusion for this test in terms of the variables in the application. [ 6 marks] (v) Cornplete the misoing t-test in the output, Le. tust whether Age is a good proflictor of CCdebt at the level. Include the hypotheses being tested, the calculation of the tent statintic, a rejection region, a decision and conclesion. [4 markex] (vi) The cutput below provides a prediction iaterval and a confidence interval for the response when Income , Loons and . Explain when to use a prediction interval versus a coeffdenee interval by providing an interpretation for ench, Fefurencing the application. irediction interval for the repane: Coefidenee interval for ther tespotise: tit avr apr [5 maiky)