Home /
Expert Answers /
Statistics and Probability /
see-pictures-a-realtor-studies-the-relationship-between-the-size-of-a-house-in-square-feet-and-the-pa195
(Solved): See Pictures A realtor studies the relationship between the size of a house (in square feet) and the ...
See Pictures
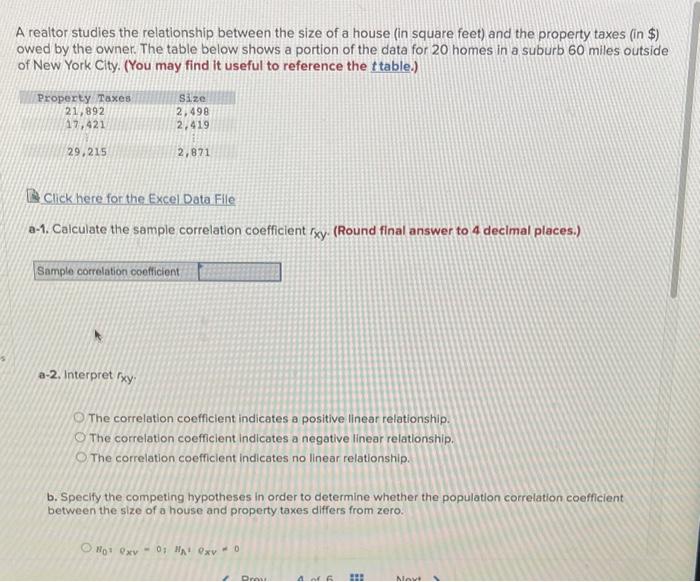
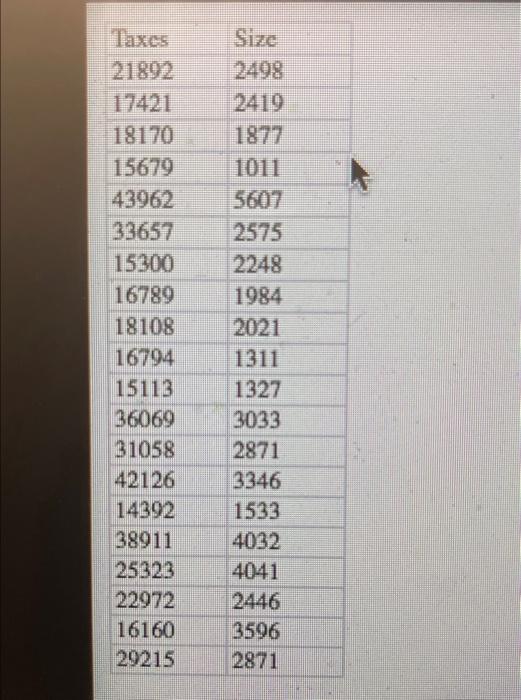
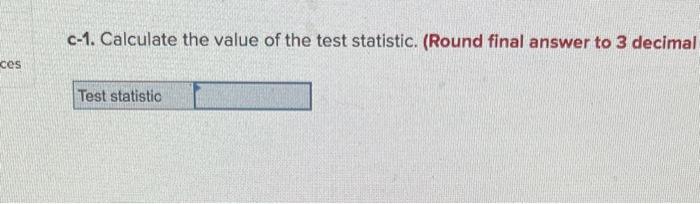
A realtor studies the relationship between the size of a house (in square feet) and the property taxes (in \( \$ \) ) owed by the owner. The table below shows a portion of the data for 20 homes in a suburb 60 miles outside of New York City. (You may find it useful to reference the \( t \) table.) A Click here for the Excel Data File a-1. Calculate the sample correlation coefficient \( r_{x y} \). (Round final answer to 4 decimal places.) a-2. Interpret \( r_{x y} \) : The correlation coefficient indicates a positive linear relationship. The correlation coefficient indicates a negative linear relationship. The correlation coefficient indicates no linear relationship. b. Specify the competing hypotheses in order to determine whether the population correlation coefficient between the size of a house and property taxes differs from zero. \( N_{0}=e_{x v}=0 ; H_{\Lambda^{\prime}} e_{x v}+0 \) \begin{tabular}{|l|l|} \hline Taxes & Size \\ \hline 21892 & 2498 \\ \hline 17421 & 2419 \\ \hline 18170 & 1877 \\ \hline 15679 & 1011 \\ \hline 43962 & 5607 \\ \hline 33657 & 2575 \\ \hline 15300 & 2248 \\ \hline 16789 & 1984 \\ \hline 18108 & 2021 \\ \hline 16794 & 1311 \\ \hline 15113 & 1327 \\ \hline 36069 & 3033 \\ \hline 31058 & 2871 \\ \hline 42126 & 3346 \\ \hline 14392 & 1533 \\ \hline 38911 & 4032 \\ \hline 25323 & 4041 \\ \hline 22972 & 2446 \\ \hline 16160 & 3596 \\ \hline 29215 & 2871 \\ \hline \end{tabular} c-1. Calculate the value of the test statistic. (Round final answer to 3 decimal
Expert Answer
Taxes x Size y xy x^2 y^2 21892 2498 54686216 479259664 6240004 17421 2419 42141399 303491241 5851561 18170 1877 34105090 330148900 3523129 15679 1011