(Solved): Stemplots and Histograms 1 1 point Consider two graphs: the left graph is a frequency histogram the ...
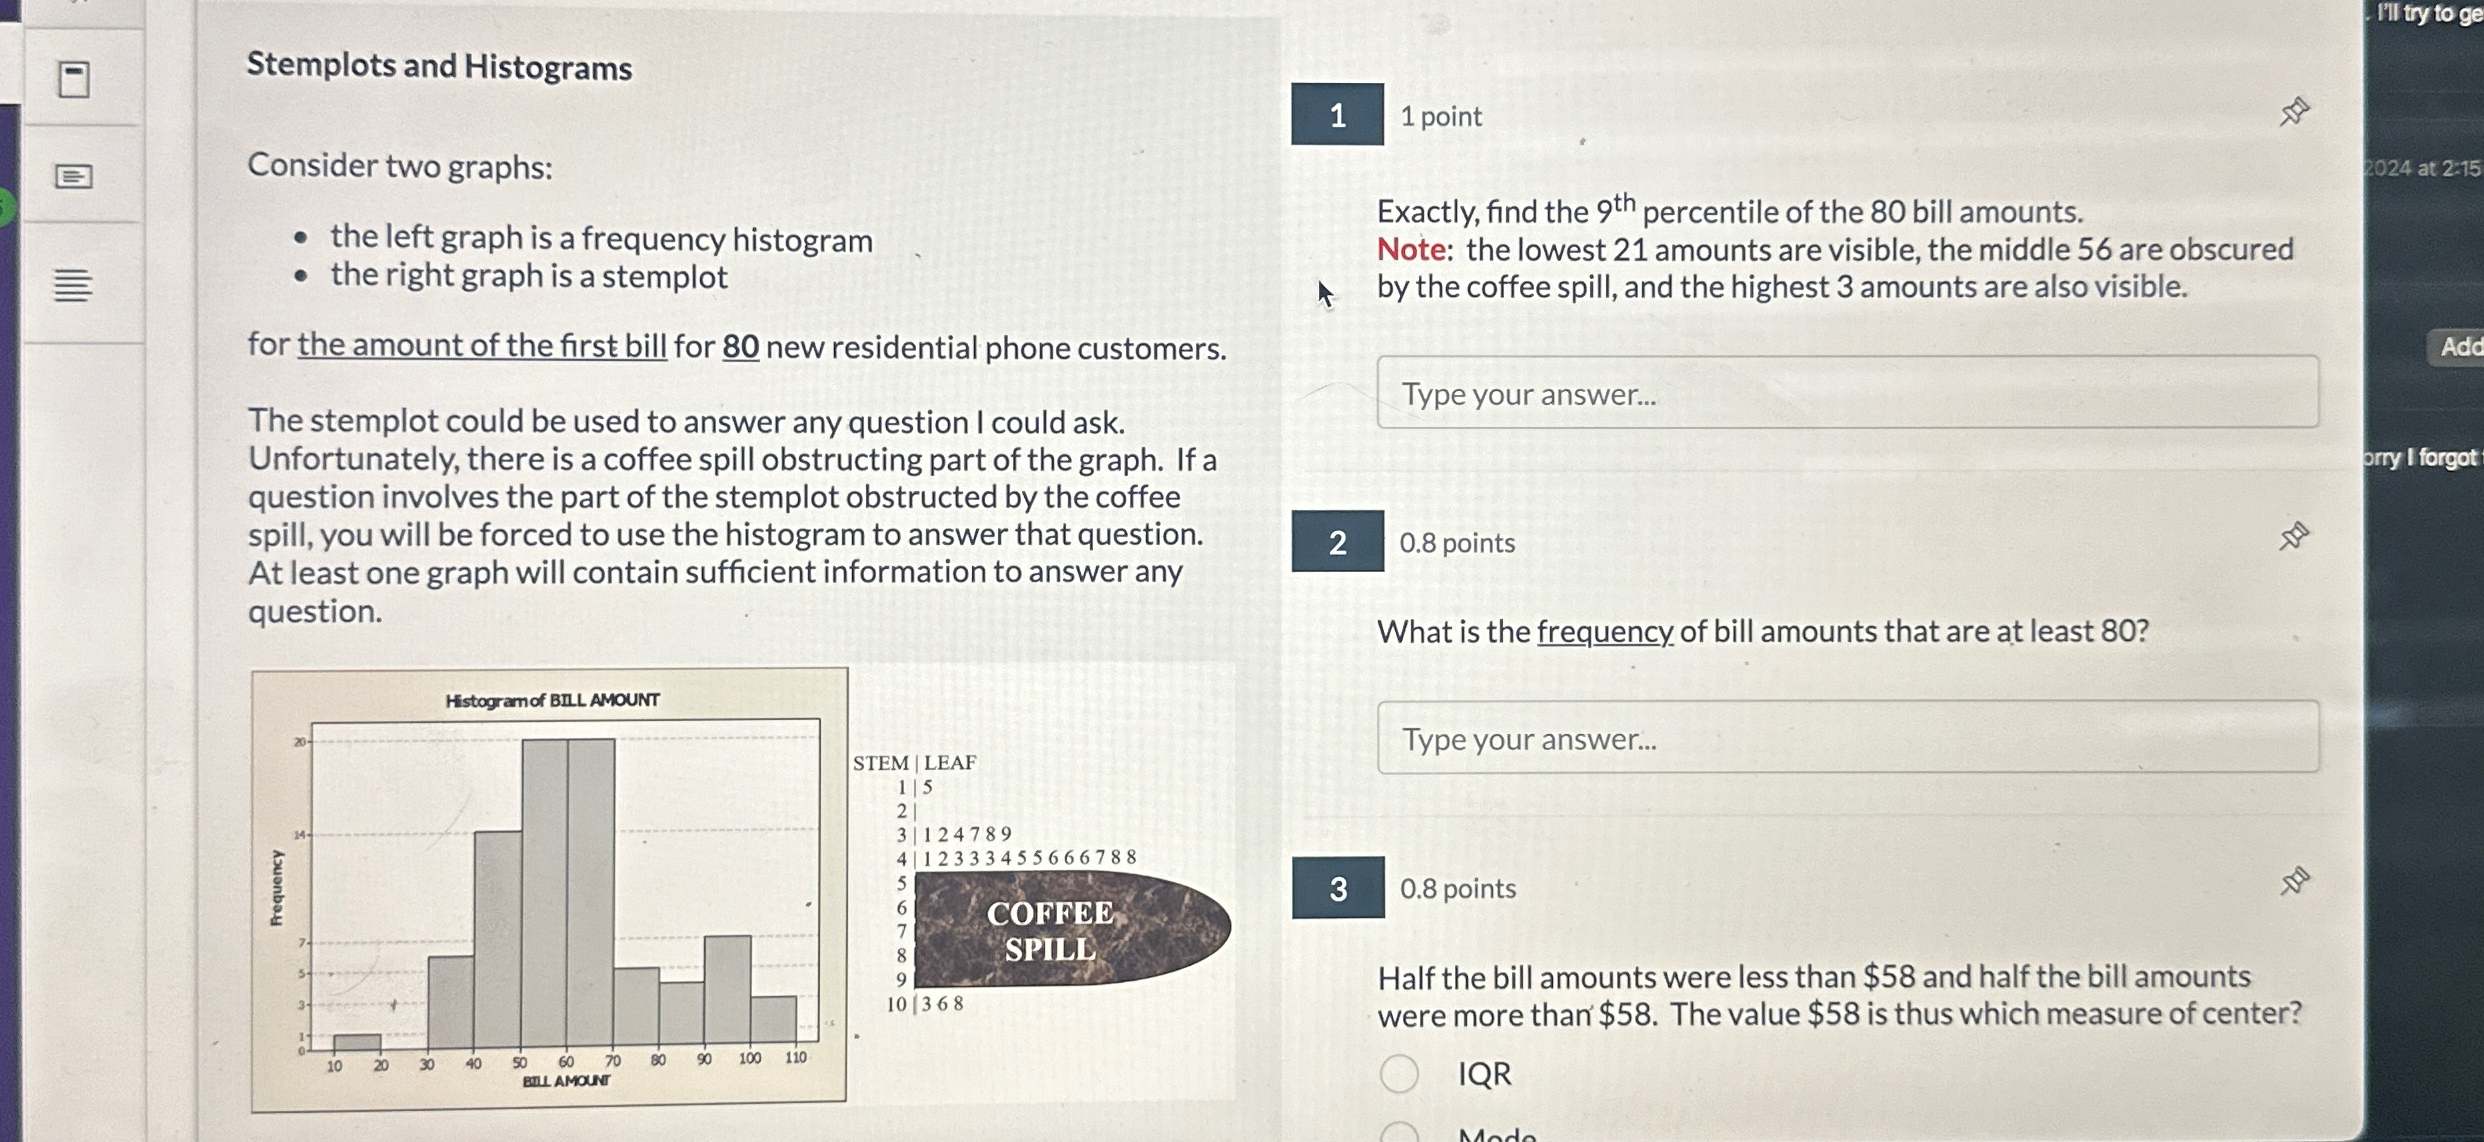
Stemplots and Histograms 1 1 point Consider two graphs: the left graph is a frequency histogram the right graph is a stemplot for the amount of the first bill for 80 new residential phone customers. The stemplot could be used to answer any question I could ask. Unfortunately, there is a coffee spill obstructing part of the graph. If a question involves the part of the stemplot obstructed by the coffee spill, you will be forced to use the histogram to answer that question. At least one graph will contain sufficient information to answer any question. Exactly, find the
9^(th )percentile of the 80 bill amounts. Note: the lowest 21 amounts are visible, the middle 56 are obscured by the coffee spill, and the highest 3 amounts are also visible. 2 0.8 points What is the frequency of bill amounts that are at least 80 ? 0.8 points Half the bill amounts were less than
$58and half the bill amounts were more than
$58. The value
$58is thus which measure of center?
◻IQR