(Solved): \table[[1 Tail,0.2,0.1,0.05,0.025,0.01,0.005],[2 Tail,0.4,0.2,0.1,0.05,0.02,0.01],[Conf Lev,0.6,0.8, ...
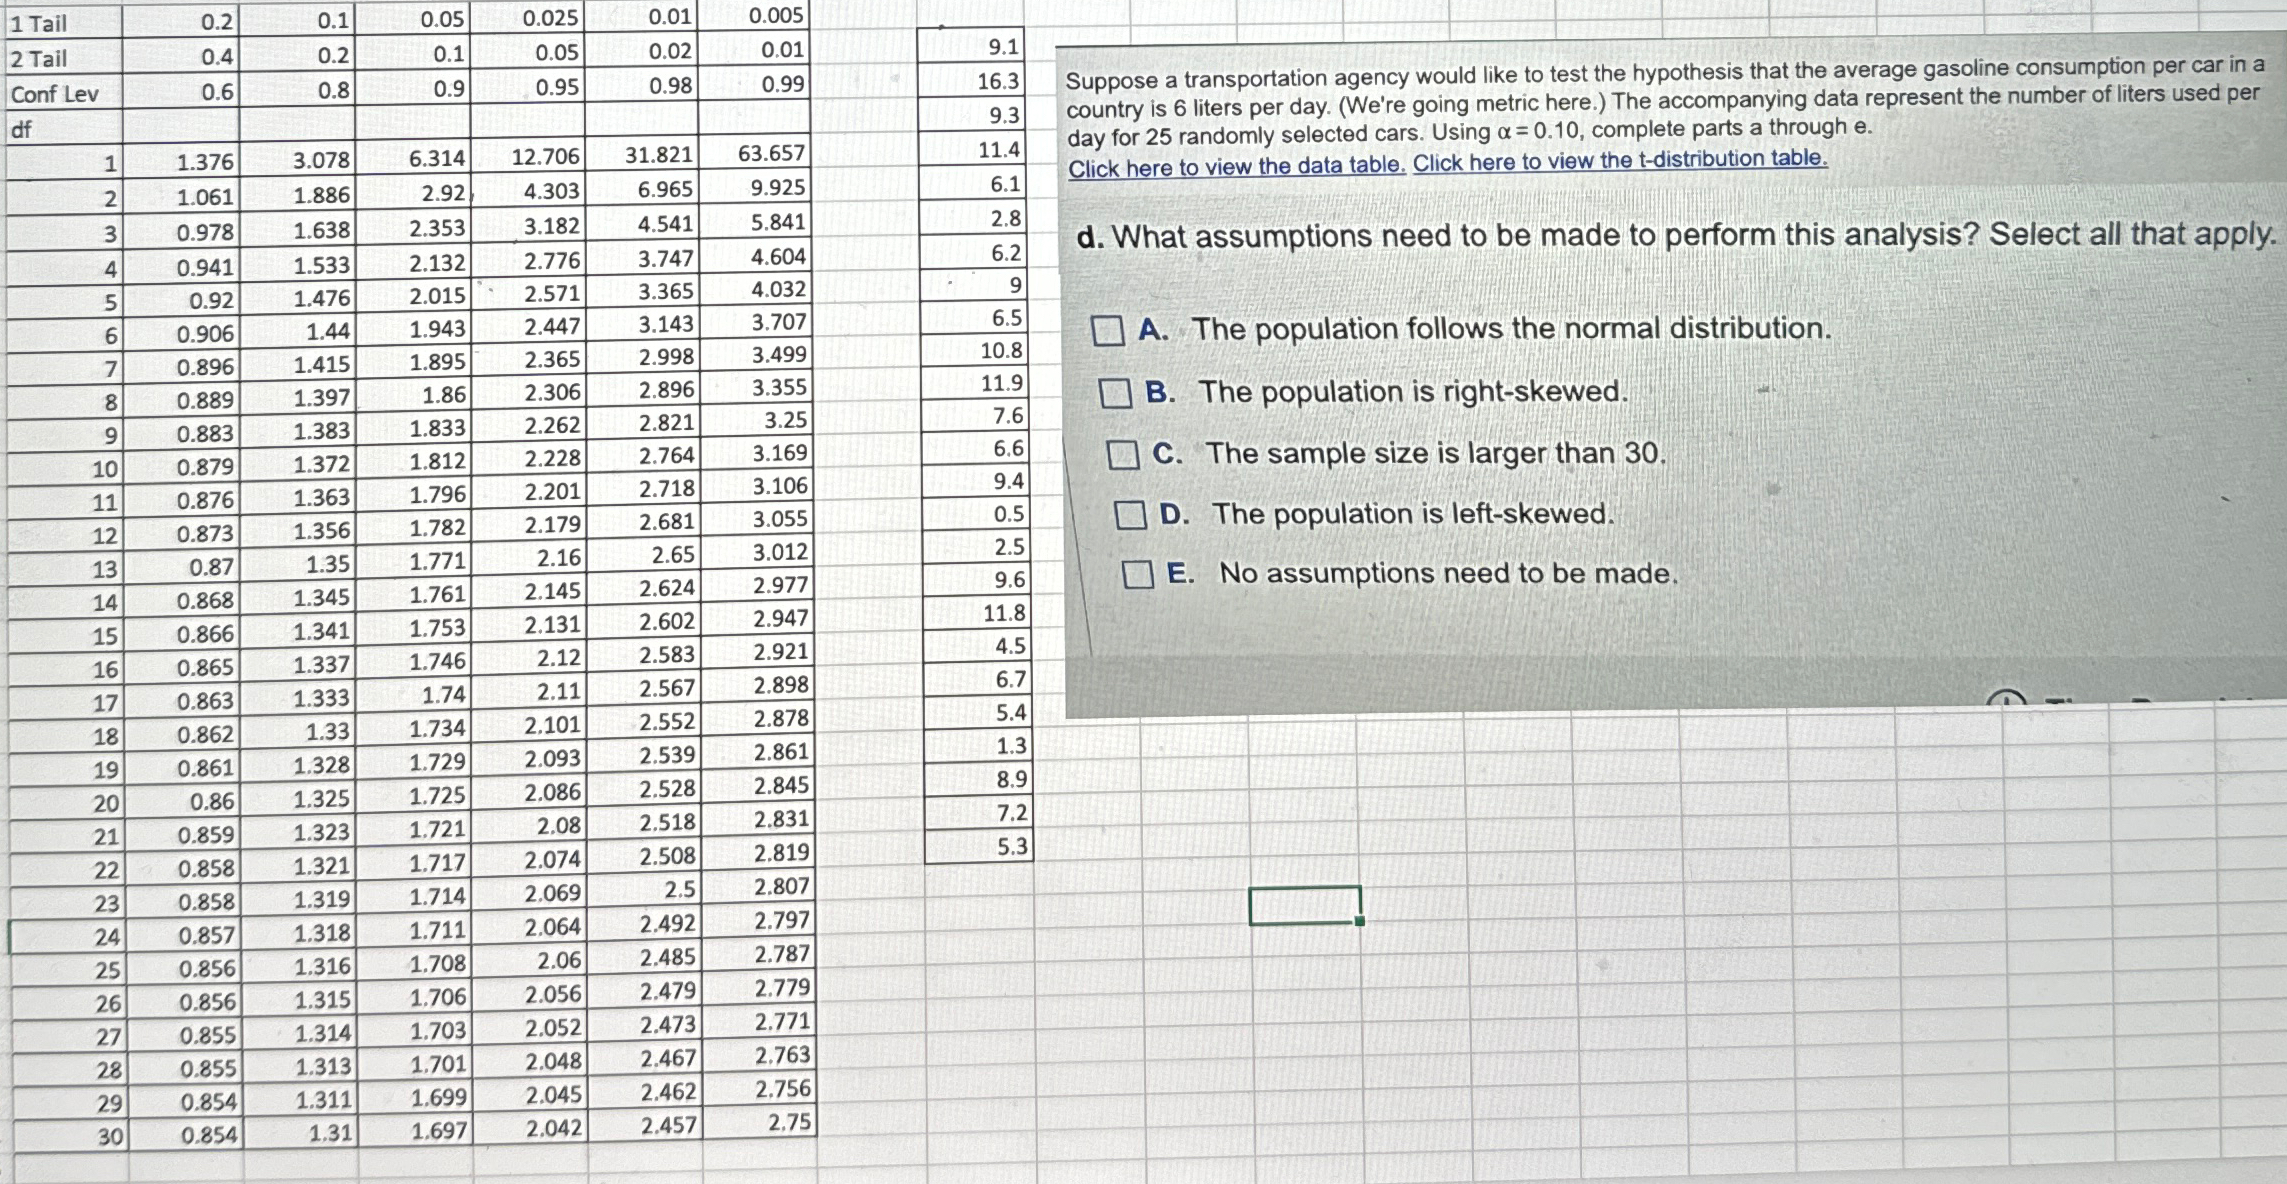
\table[[1 Tail,0.2,0.1,0.05,0.025,0.01,0.005],[2 Tail,0.4,0.2,0.1,0.05,0.02,0.01],[Conf Lev,0.6,0.8,0.9,0.95,0.98,0.99],[df,,,,,,],[1,1.376,3.078,6.314,12.706,31.821,63.657],[2,1.061,1.886,2.92,4.303,6.965,9.925],[3,0.978,1.638,2.353,3.182,4.541,5.841],[4,0.941,1.533,2.132,2.776,3.747,4.604],[5,0.92,1.476,2.015,2.571,3.365,4.032],[6,0.906,1.44,1.943,2.447,3.143,3.707],[7,0.896,1.415,1.895,2.365,2.998,3.499],[8,0.889,1.397,1.86,2.306,2.896,3.355],[9,0.883,1.383,1.833,2.262,2.821,3.25],[10,0.879,1.372,1.812,2.228,2.764,3.169],[11,0.876,1.363,1.796,2.201,2.718,3.106],[12,0.873,1.356,1.782,2.179,2.681,3.055],[13,0.87,1.35,1.771,2.16,2.65,3.012],[14,0.868,1.345,1.761,2.145,2.624,2.977],[15,0.866,1.341,1.753,2.131,2.602,2.947],[16,0.865,1.337,1.746,2.12,2.583,2.921],[17,0.863,1.333,1.74,2.11,2.567,2.898],[18,0.862,1.33,1.734,2.101,2.552,2.878],[19,0.861,1.328,1.729,2.093,2.539,2.861],[20,0.86,1.325,1.725,2.086,2.528,2.845],[21,0.859,1.323,1.721,2.08,2.518,2.831],[22,0.858,1.321,1.717,2.074,2.508,2.819],[23,0.858,1.319,1.714,2.069,2.5,2.807],[24,0.857,1.318,1.711,2.064,2.492,2.797],[25,0.856,1.316,1.708,2.06,2.485,2.787],[26,0.856,1.315,1.706,2.056,2.479,2.779],[27,0.855,1.314,1.703,2.052,2.473,2.771],[28,0.855,1.313,1.701,2.048,2.467,2.763],[29,0.854,1.311,1.699,2.045,2.462,2.756],[30,0.854,1.31,1.697,2.042,2.457,2.75]] \table[[9.1],[16.3],[9.3],[11.4],[6.1],[2.8],[6.2],[9],[6.5],[10.8],[11.9],[7.6],[6.6],[9.4],[0.5],[2.5],[9.6],[11.8],[4.5],[6.7],[5.4],[1.3],[8.9],[7.2],[5.3]] Suppose a transportation agency would like to test the hypothesis that the average gasoline consumption per car in a country is 6 liters per day. (We're going metric here.) The accompanying data represent the number of liters used per day for 25 randomly selected cars. Using
\alpha =0.10, complete parts a through
e. Click here to view the data table. Click here to view the t-distribution table. d. What assumptions need to be made to perform this analysis? Select all that apply. A. The population follows the normal distribution. B. The population is right-skewed. C. The sample size is larger than 30 . D. The population is left-skewed. E. No assumptions need to be made.