(Solved): The above figure shows the AE curve and 45\deg line for an economy. a. If real GDP equals $8 trilli ...
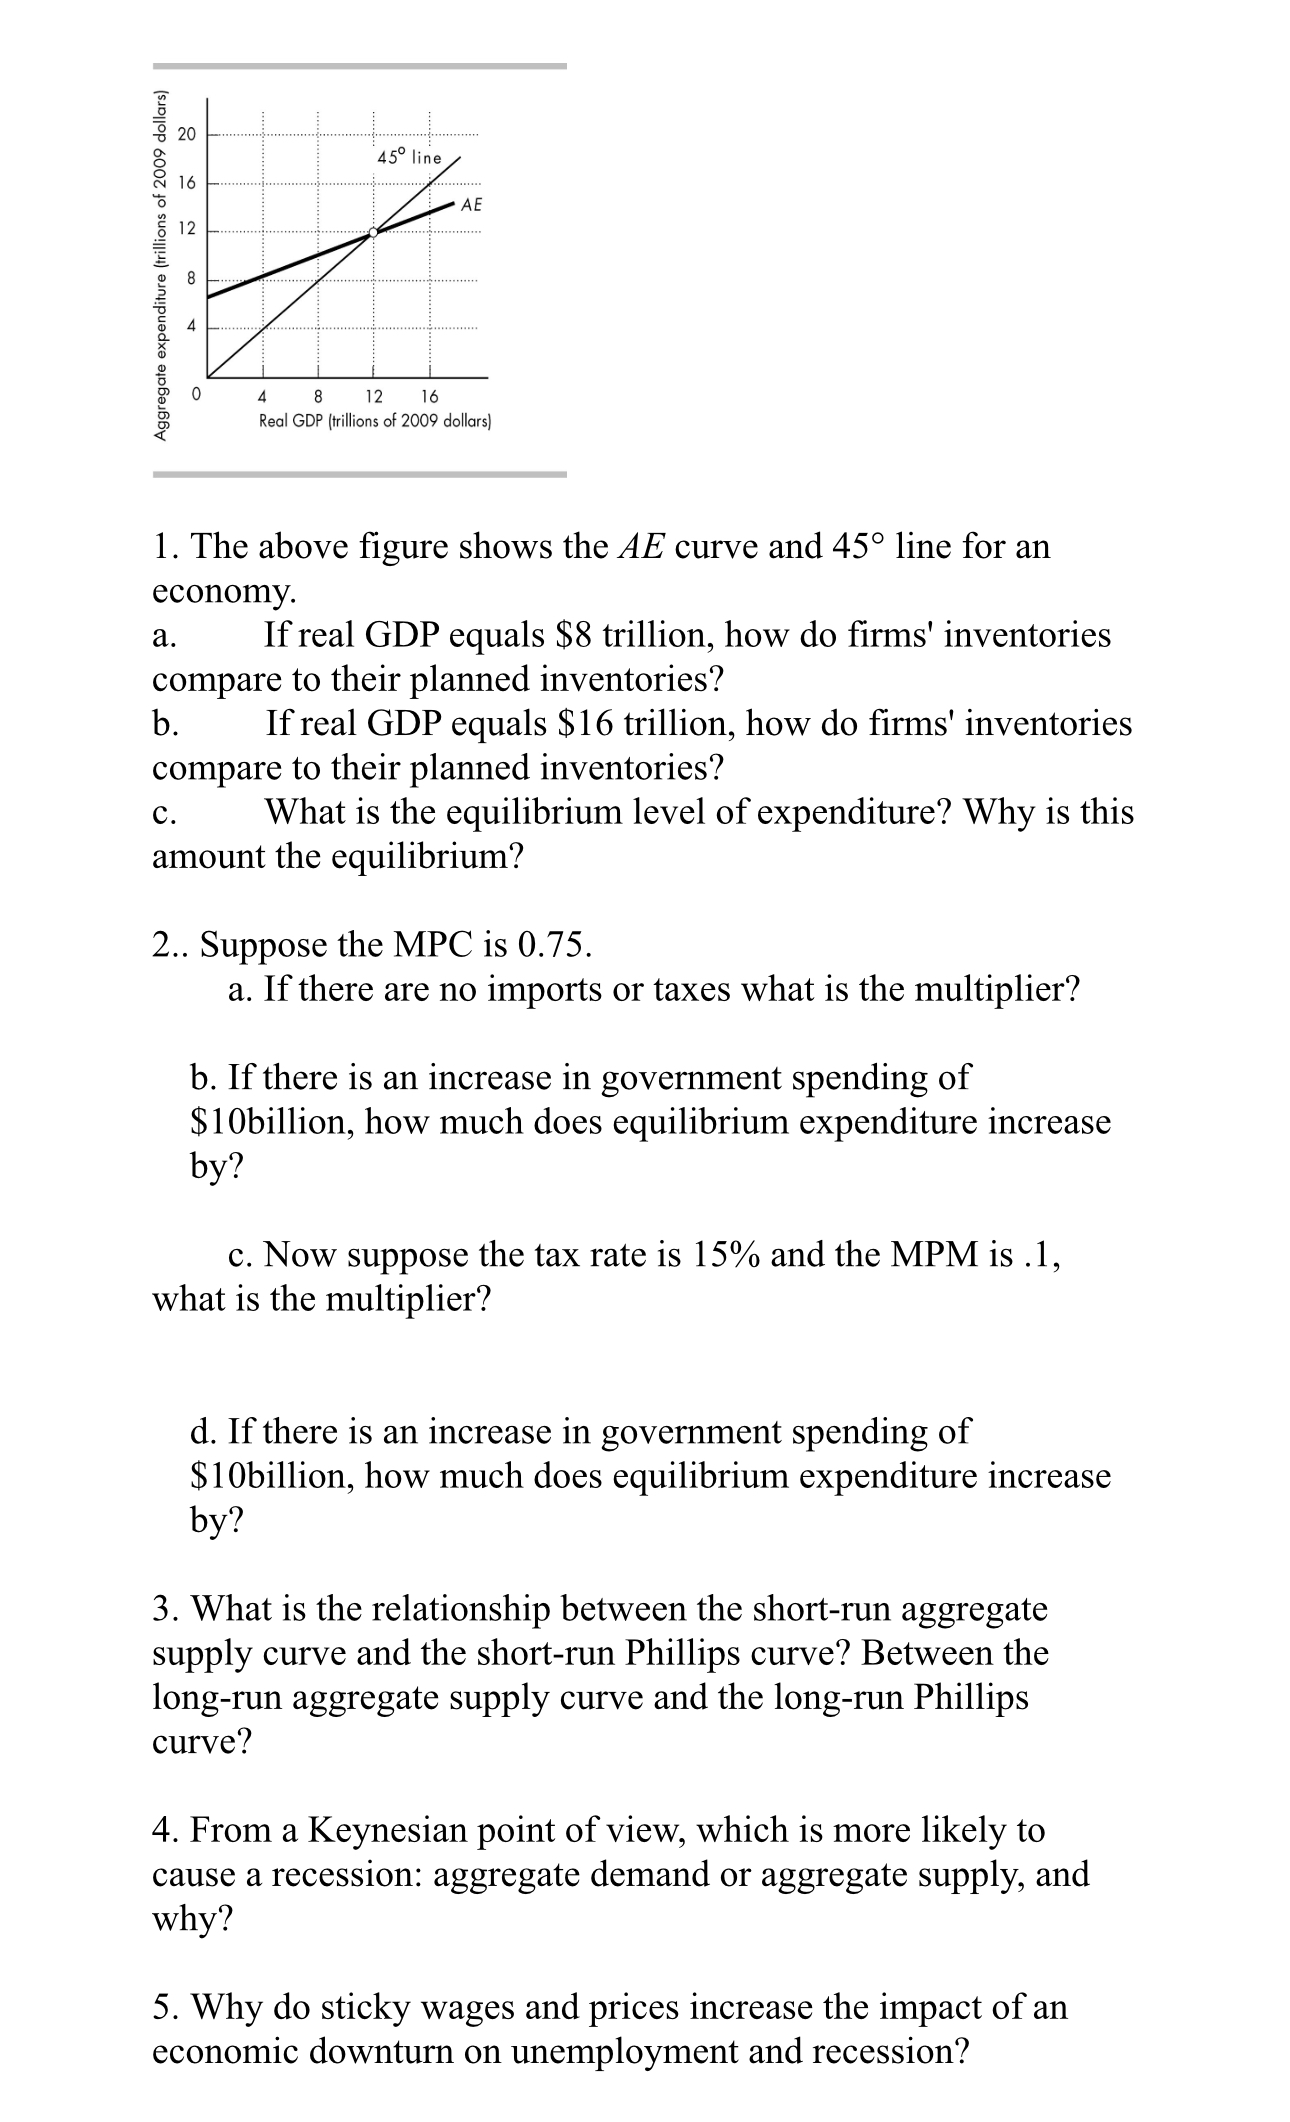
The above figure shows the
AEcurve and
45\deg line for an economy. a. If real GDP equals
$8trillion, how do firms' inventories compare to their planned inventories? b. If real GDP equals
$16trillion, how do firms' inventories compare to their planned inventories? c. What is the equilibrium level of expenditure? Why is this amount the equilibrium? 2.. Suppose the MPC is 0.75 . a. If there are no imports or taxes what is the multiplier? b. If there is an increase in government spending of $10billion, how much does equilibrium expenditure increase by? c. Now suppose the tax rate is
15%and the MPM is .1 , what is the multiplier? d. If there is an increase in government spending of $10billion, how much does equilibrium expenditure increase by? What is the relationship between the short-run aggregate supply curve and the short-run Phillips curve? Between the long-run aggregate supply curve and the long-run Phillips curve? From a Keynesian point of view, which is more likely to cause a recession: aggregate demand or aggregate supply, and why? Why do sticky wages and prices increase the impact of an economic downturn on unemployment and recession?