Home /
Expert Answers /
Mechanical Engineering /
the-block-diagram-of-a-controlled-system-is-shown-in-figure-q-iii-the-bode-diagram-of-the-open-lo-pa546
(Solved): The block diagram of a controlled system is shown in Figure Q.III. The Bode diagram of the open lo ...
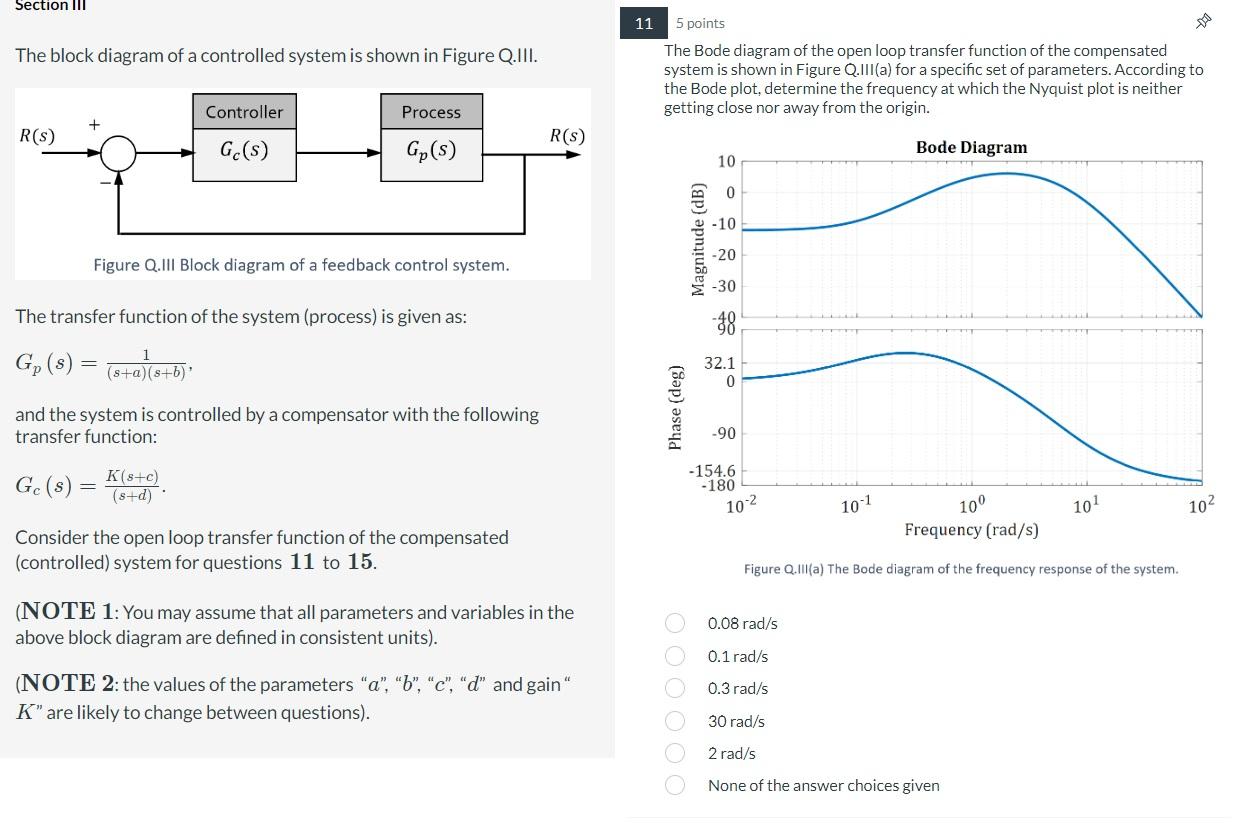
The block diagram of a controlled system is shown in Figure Q.III. The Bode diagram of the open loop transfer function of the compensated system is shown in Figure Q.III(a) for a specific set of parameters. According to the Bode plot, determine the frequency at which the Nyquist plot is neither getting close nor away from the origin. The transfer function of the system (process) is given as: \[ G_{p}(s)=\frac{1}{(s+a)(s+b)}, \] and the system is controlled by a compensator with the following transfer function: \[ G_{c}(s)=\frac{K(s+c)}{(s+d)} \] Consider the open loop transfer function of the compensated (controlled) system for questions \( \mathbf{1 1} \) to \( \mathbf{1 5} \). Figure Q.III(a) The Bode diagram of the frequency response of the system. (NOTE 1: You may assume that all parameters and variables in the above block diagram are defined in consistent units). \( 0.08 \mathrm{rad} / \mathrm{s} \) (NOTE 2: the values of the parameters " \( a \) ", " \( b \) ", " \( c \) ", " \( d \) " and gain" \( 0.1 \mathrm{rad} / \mathrm{s} \) \( K^{\prime \prime} \) are likely to change between questions). \( 0.3 \mathrm{rad} / \mathrm{s} \) \( 30 \mathrm{rad} / \mathrm{s} \) \( 2 \mathrm{rad} / \mathrm{s} \) None of the answer choices given