Home /
Expert Answers /
Advanced Math /
the-figure-below-is-a-graph-of-the-equation-y-cos-3-x-3-cos-x-it-has-seven-turning-points-pa199
(Solved): The figure below is a graph of the equation \( y=\cos 3 x-3 \cos x \). It has seven turning points ...
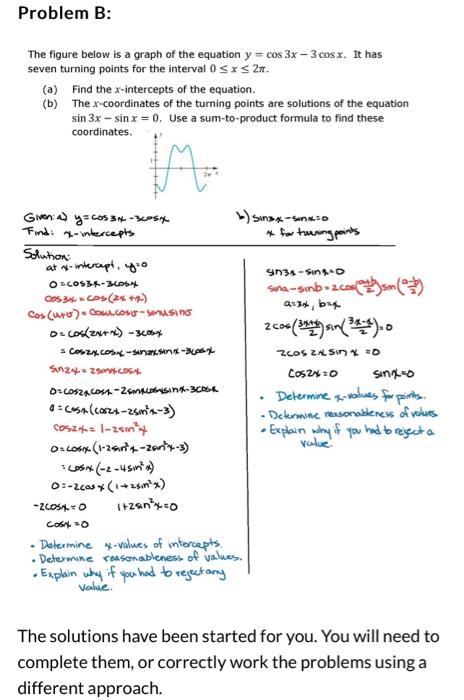
The figure below is a graph of the equation \( y=\cos 3 x-3 \cos x \). It has seven turning points for the interval \( 0 \leq x \leq 2 \pi \). (a) Find the \( x \)-intercepts of the equation. (b) The \( x \)-coordinates of the turning points are solutions of the equation \( \sin 3 x-\sin x=0 \). Use a sum-to-product formula to find these coordinates. Given: a) \( y=\cos 3 x-3 \cos x \) b) \( \sin 3 x-\sin x=0 \) Find: \( x \)-intercepts \( x \) for twing paints - Determine \( y \)-values of intercepts. - Determine reasonableness of values. - Explain why if you had to rejectany value. The solutions have been started for you. You will need to complete them, or correctly work the problems using a different approach.
Expert Answer
For both the parts, since the x