Home /
Expert Answers /
Economics /
the-figure-below-shows-a-hypothetical-market-for-gasoline-prica-structions-round-your-answers-to-pa178
(Solved): The figure below shows a hypothetical market for gasoline. Prica structions: Round your answers to ...

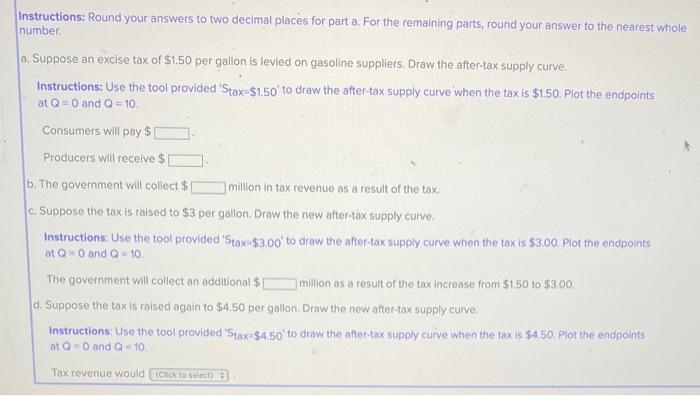
The figure below shows a hypothetical market for gasoline. Prica
structions: Round your answers to two decimal places for part a. For the remaining parts, round your answer to the nearest whole umber: Suppose an excise tax of \( \$ 1.50 \) per galion is levied on gasoline suppliers. Draw the after-tax supply curve: Instructions: Use the tool provided 'Stax \( =\$ 1.50 \) ' to draw the after-tax supply curve when the tax is \( \$ 1.50 \). Plot the endpoints at \( Q=0 \) and \( Q=10 \). Consumers will pay \( \$ \) Producers will recelve \( \$ \) b. The government will coliect \( \$ \quad \) million in tax revenue as a result of the tax. c. Suppose the tax is raised to \( \$ 3 \) per gallon. Draw the new after-tax supply curve. Instructions: Use the tool provided 'Stax-\$3.00' to draw the after-tax supply curve when the tax is \( \$ 3.00 \). Plot the endpoints at \( Q=0 \) and \( Q=10 \). The government will collect an additional \$ million as a result of the tax increase from \( \$ 1.50 \) to \( \$ 3.00 \). d. Suppose the tax is raised again to \( \$ 4.50 \) per gallon. Draw the new after-tax supply curve. Instructions: Use the tool provided 'Stax-\$4.50' to draw the after-tax supply curve when the tax is \( \$ 4.50 \). Plot the endpoints at \( Q=0 \) and \( Q=10 \), Tax revenue would
Expert Answer
Answer:: a) The tax discourages production so supply shifts up by 1.50 for every unit. This is s