Home /
Expert Answers /
Economics /
the-figure-to-the-right-illustrates-the-average-total-cost-atc-and-marginal-cost-mc-curves-for-pa563
(Solved): The figure to the right illustrates the average total cost (ATC) and marginal cost (MC) curves for ...
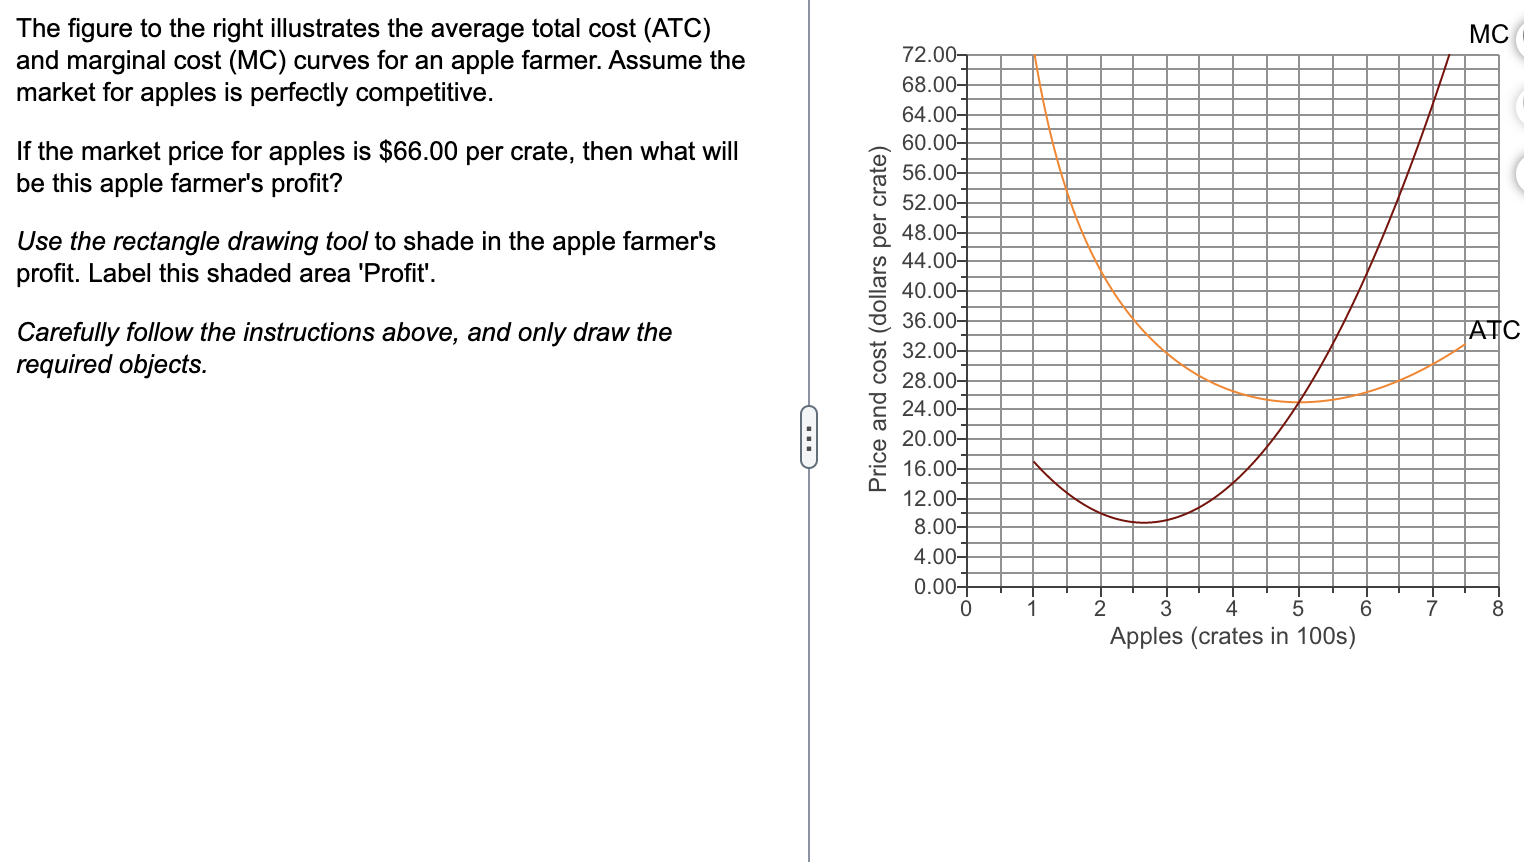
The figure to the right illustrates the average total cost (ATC) and marginal cost (MC) curves for an apple farmer. Assume the market for apples is perfectly competitive. If the market price for apples is per crate, then what will be this apple farmer's profit? Use the rectangle drawing tool to shade in the apple farmer's profit. Label this shaded area 'Profit'. Carefully follow the instructions above, and only draw the required objects.