Home /
Expert Answers /
Economics /
the-following-graph-input-tool-shows-the-daily-demand-for-hotel-rooms-at-the-oceans-hotel-and-casi-pa378
(Solved): The following graph input tool shows the daily demand for hotel rooms at the Oceans Hotel and Casi ...
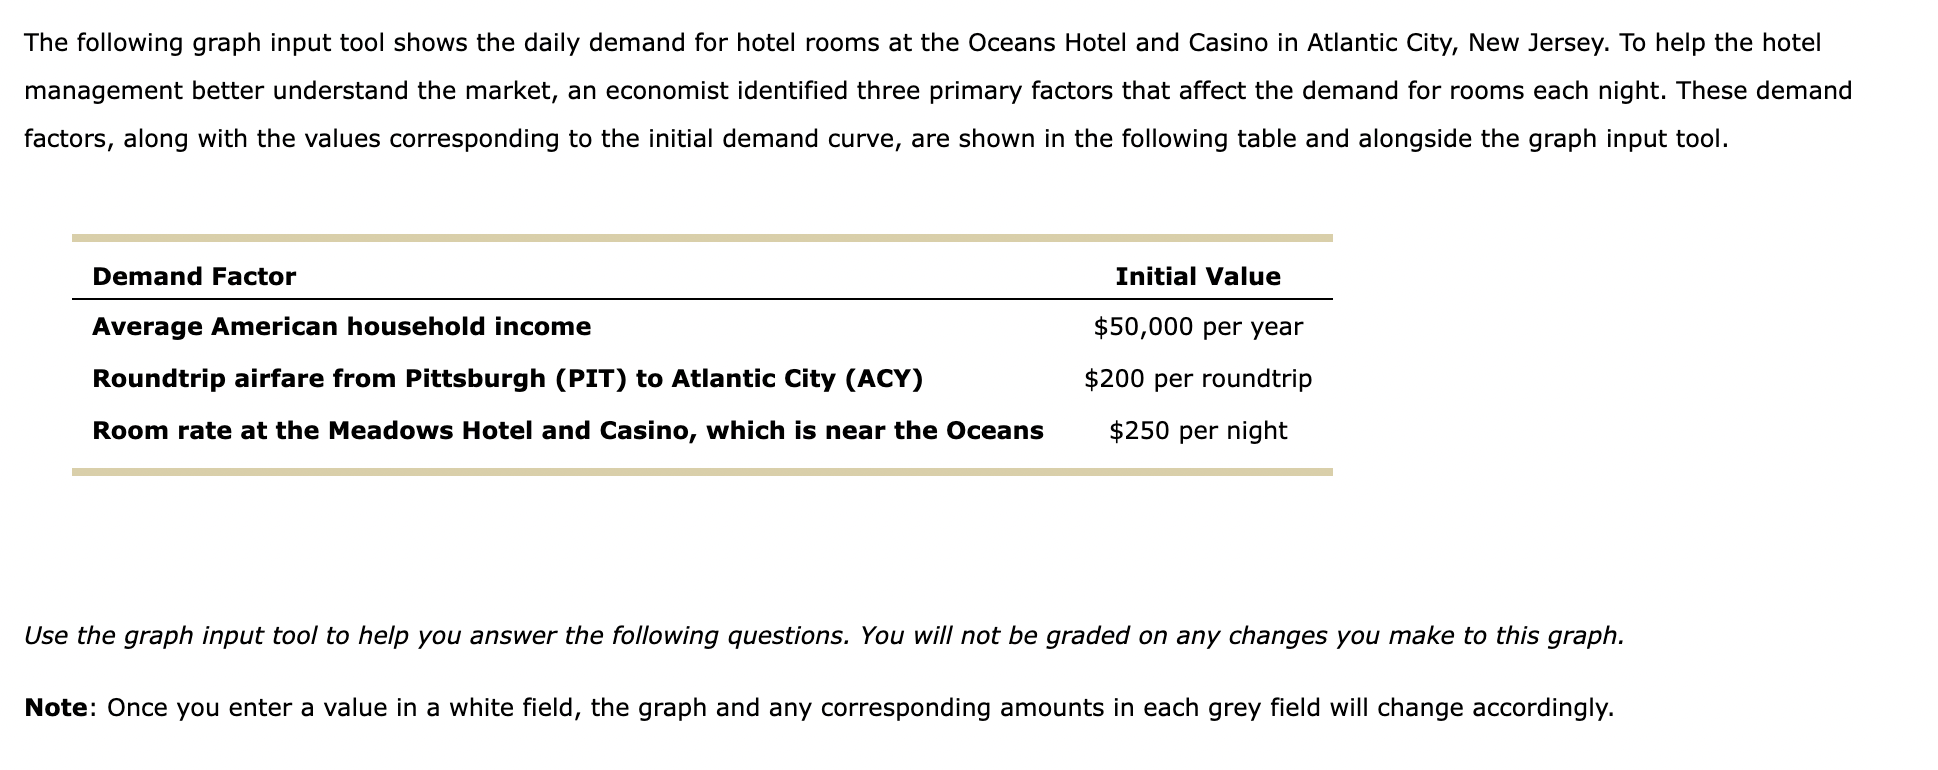
The following graph input tool shows the daily demand for hotel rooms at the Oceans Hotel and Casino in Atlantic City, New Jersey. To help the hotel management better understand the market, an economist identified three primary factors that affect the demand for rooms each night. These demand factors, along with the values corresponding to the initial demand curve, are shown in the following table and alongside the graph input tool. Use the graph input tool to help you answer the following questions. You will not be graded on any changes you make to this graph. Note: Once you enter a value in a white field, the graph and any corresponding amounts in each grey field will change accordingly.
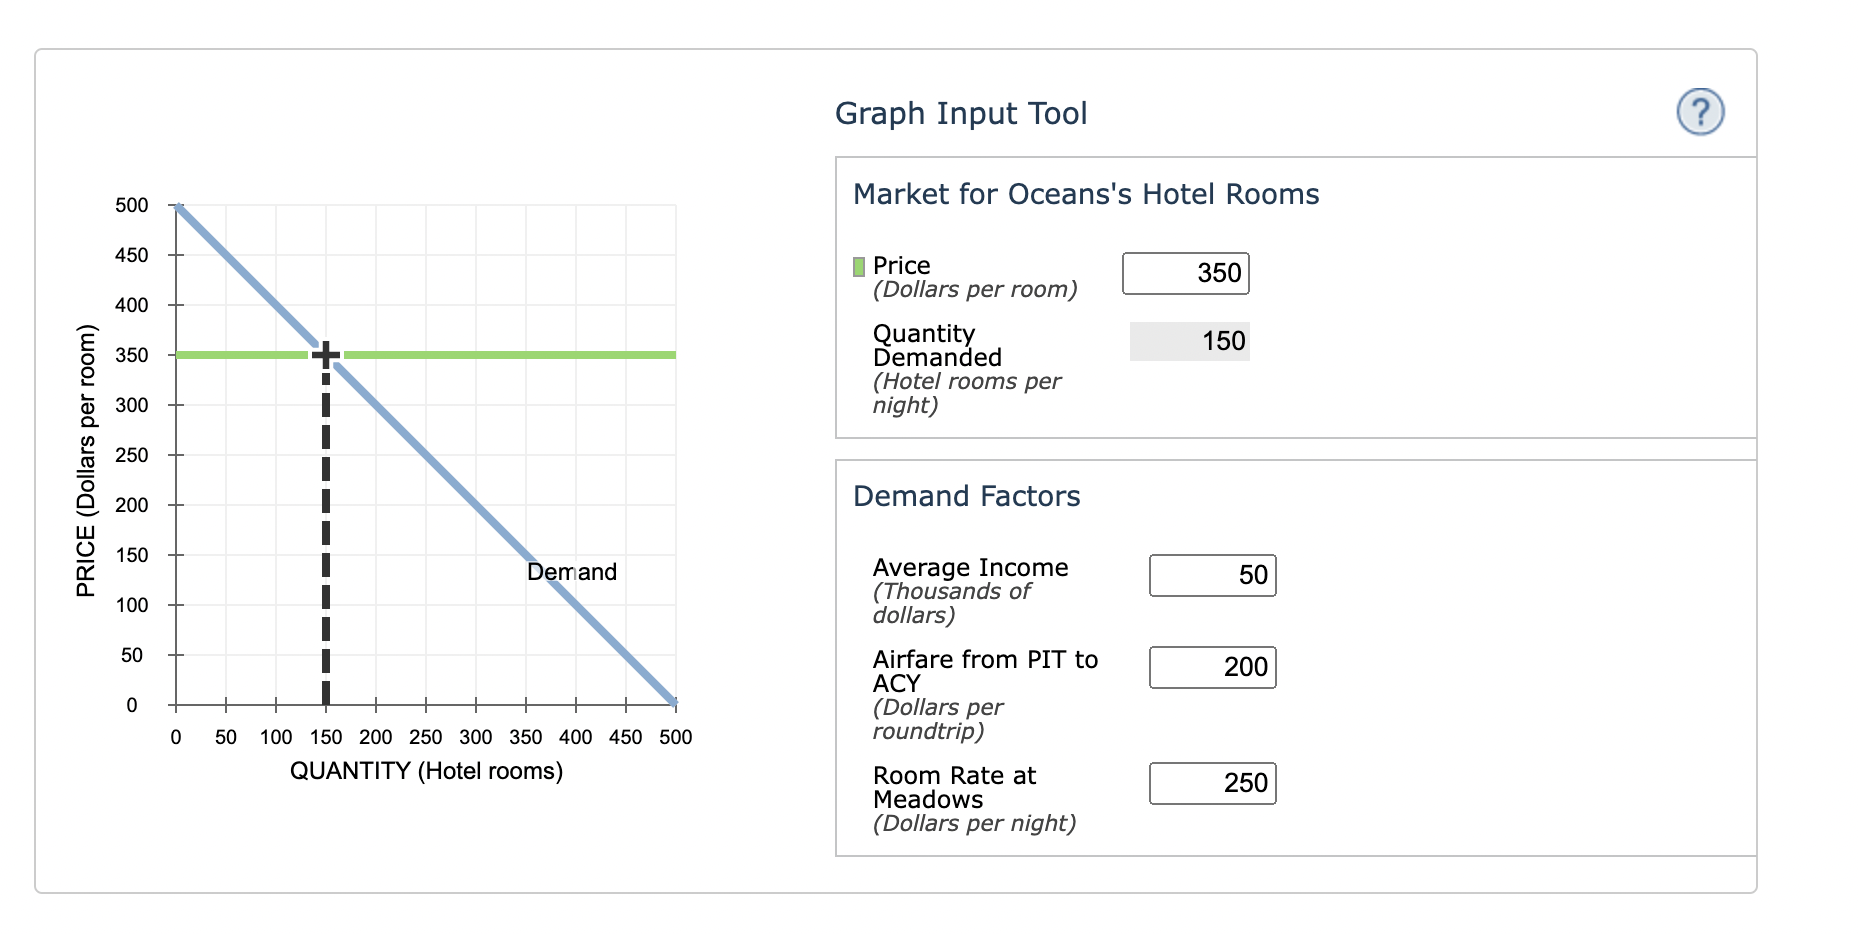
Graph Input Tool
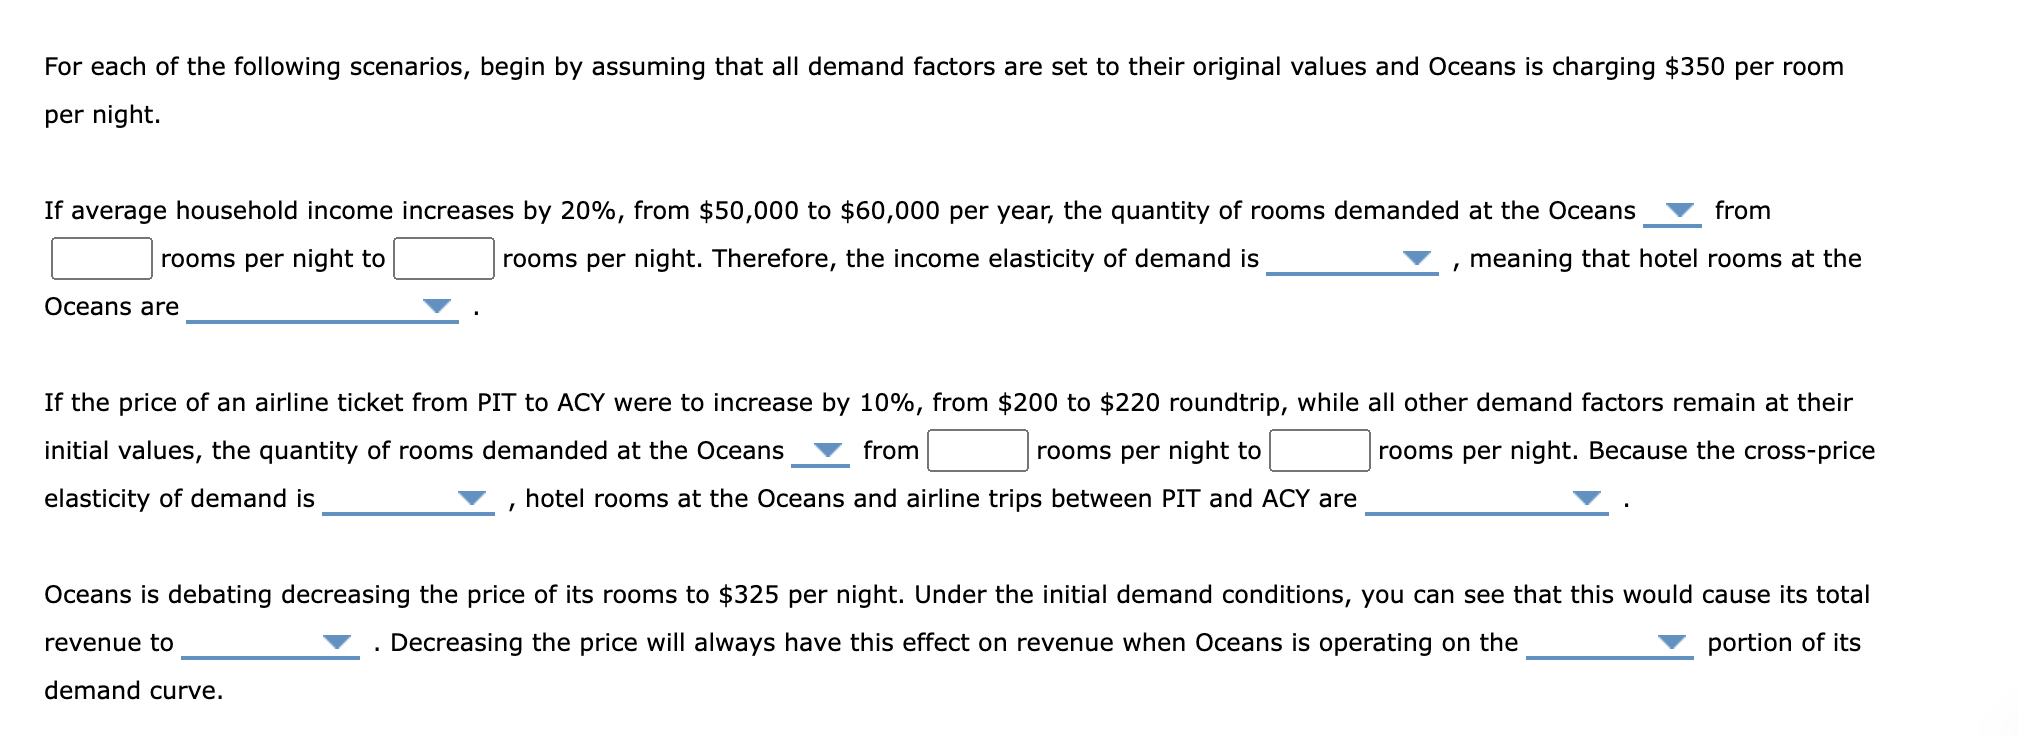
For each of the following scenarios, begin by assuming that all demand factors are set to their original values and Oceans is charging per room per night. If average household income increases by , from to per year, the quantity of rooms demanded at the Oceans rooms per night to rooms per night. Therefore, the income elasticity of demand is , meaning that hotel rooms at the Oceans are If the price of an airline ticket from PIT to ACY were to increase by , from to roundtrip, while all other demand factors remain at their initial values, the quantity of rooms demanded at the Oceans from rooms per night to romight. Because the cross-price elasticity of demand is , hotel rooms at the Oceans and airline trips between PIT and ACY are Oceans is debating decreasing the price of its rooms to per night. Under the initial demand conditions, you can see that this would cause its total revenue to . Decreasing the price will always have this effect on revenue when Oceans is operating on the portion of its demand curve.