Home /
Expert Answers /
Economics /
the-following-graph-represents-ronnie-39-s-demand-for-labor-to-help-him-make-cookies-in-his-cookie-s-pa455
(Solved): The following graph represents Ronnie's demand for labor to help him make cookies in his cookie shop ...
The following graph represents Ronnie's demand for labor to help him make cookies in his cookie shop. Assume this is a perfectly competitive market.
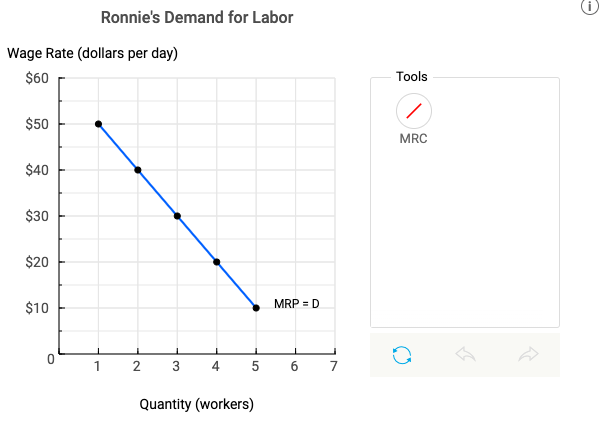
Suppose the current wage rate is $40 per day.
Part 1. Using the graph, draw Ronnie's marginal resource cost (MRC) curve for the first 5 workers.
Instructions: Use the tool provided "MRC" to plot the line point by point, starting from 0 worker up to 5 workers (6 points total).
Part 2. If the wage is $40 per day, how many workers will Ronnie want to hire? Multiple choice.
a. 3 workers
b. 2 workers
c. 1 worker
d. 4 workers
Ronnie's Demand for Labor Waae Rate (dollars ber dav)
Expert Answer
Since the labor market is perfectly company therefore the supply curve will be represented by a straight line parallel to the horizontal axis.