Home /
Expert Answers /
Economics /
the-following-graph-shows-the-aggregate-demand-curve-shift-the-aggregate-demand-curve-on-t-pa507
(Solved): The following graph shows the aggregate demand curve. Shift the aggregate demand curve on t ...
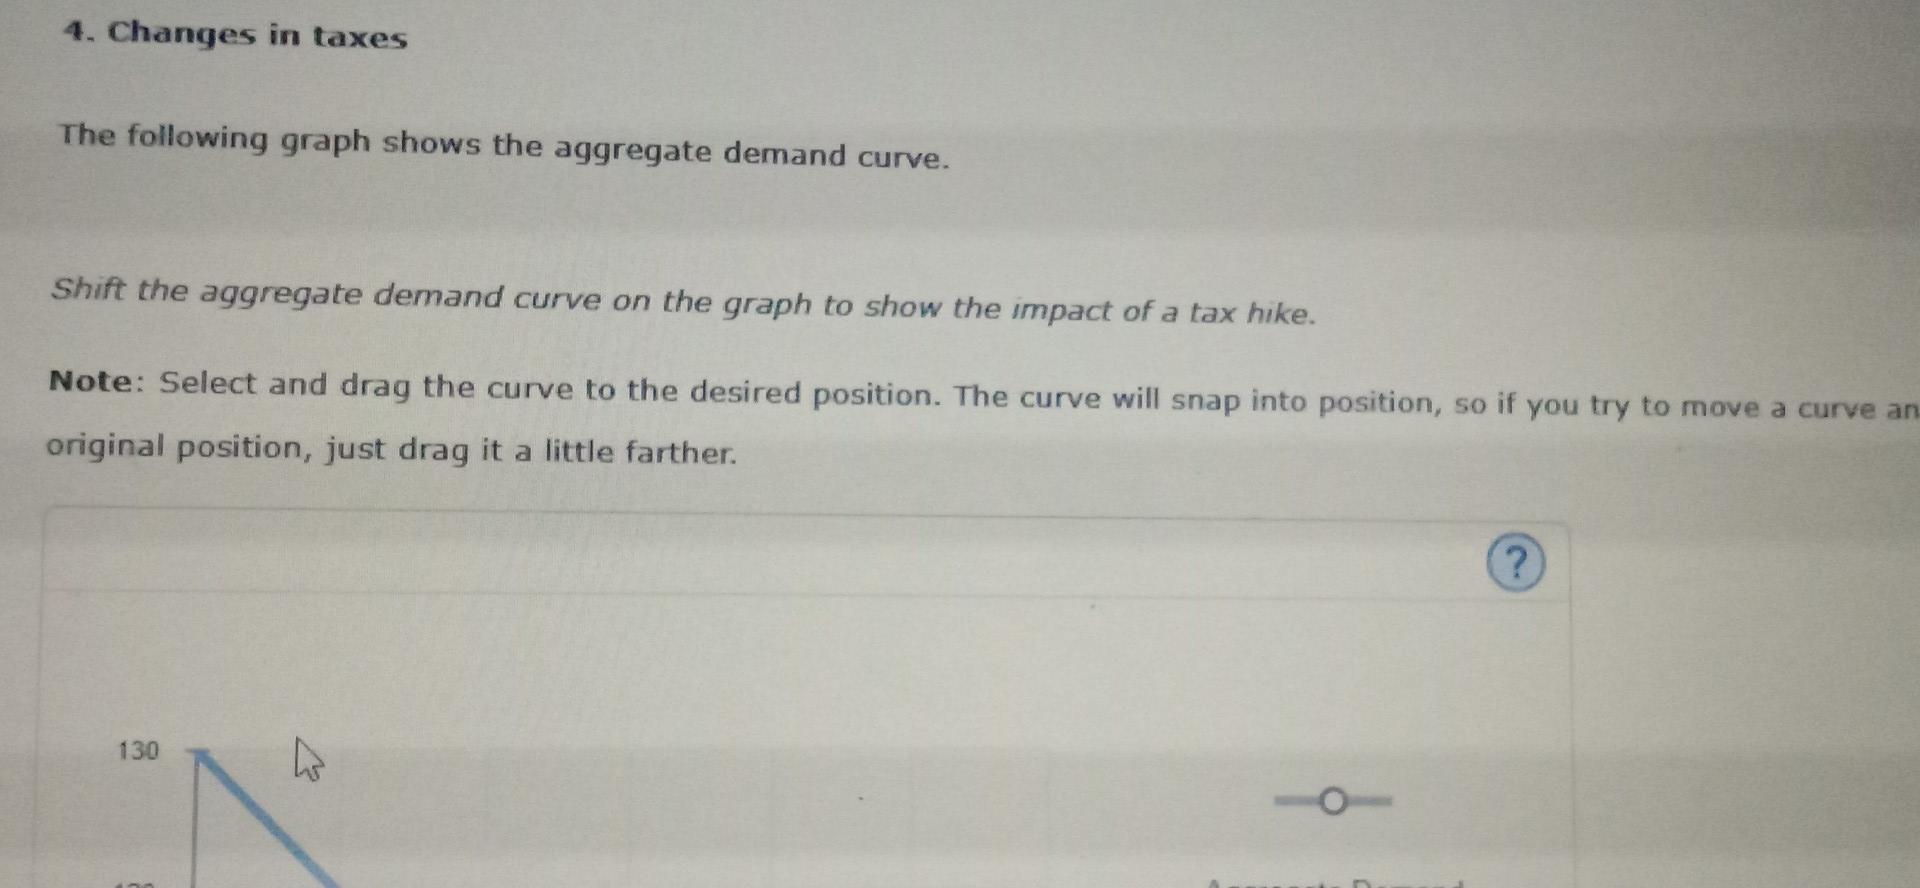

The following graph shows the aggregate demand curve. Shift the aggregate demand curve on the graph to show the impact of a tax hike. Note: Select and drag the curve to the desired position. The curve will snap into position, so if you try to move a curve ar original position, just drag it a little farther.
Suppose the governments of two different economies, economy and economy , implement a tax cut of the same siz temporary, while the tax cut in economy is permanent. The economies are identical in all other respects. The tax cut will have a smaller impact on aggregate demand in the economy with the