Home /
Expert Answers /
Chemistry /
the-following-plot-shows-a-titration-curve-for-the-titration-of-1-00-l-of-1-00-m-diprotic-acid-h-2-pa947
(Solved): The following plot shows a titration curve for the titration of 1.00 L of 1.00 M diprotic acid H_(2) ...
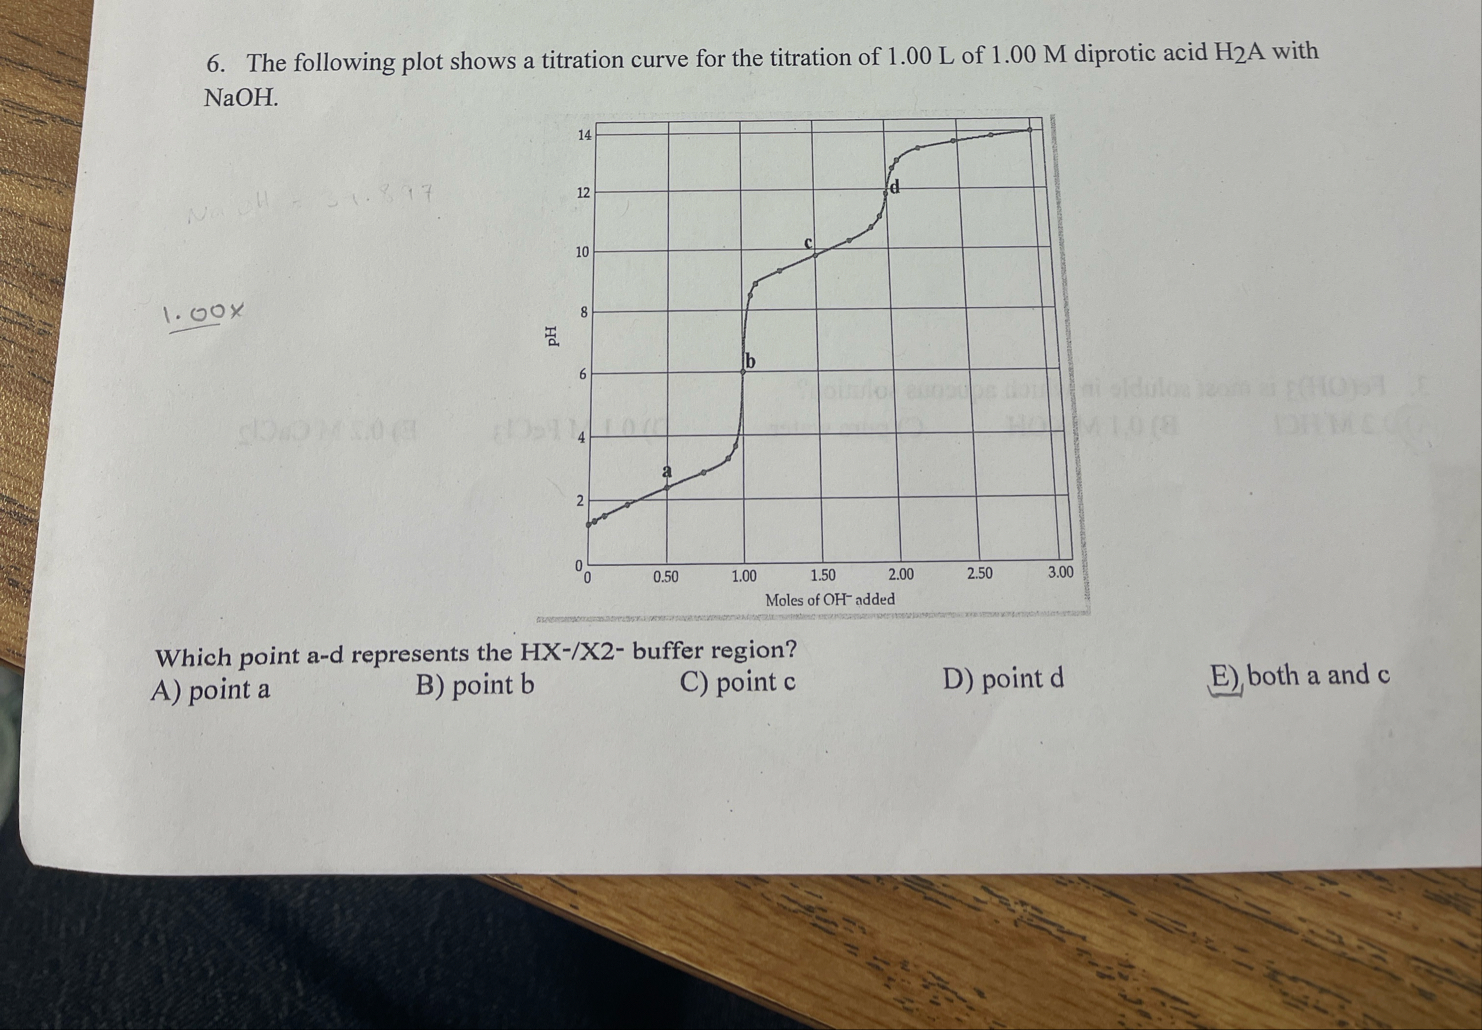
The following plot shows a titration curve for the titration of 1.00 L of 1.00 M diprotic acid
H_(2)Awith NaOH .
1.00xWhich point a-d represents the
Hx(-)/(x)2- butter region? A) point a B) point b C) point c D) point d E) both a and c