Home /
Expert Answers /
Advanced Physics /
the-following-table-gives-the-average-number-of-hours-5-junior-high-students-were-left-unsupervised-pa782
(Solved): The following table gives the average number of hours 5 junior high students were left unsupervised ...
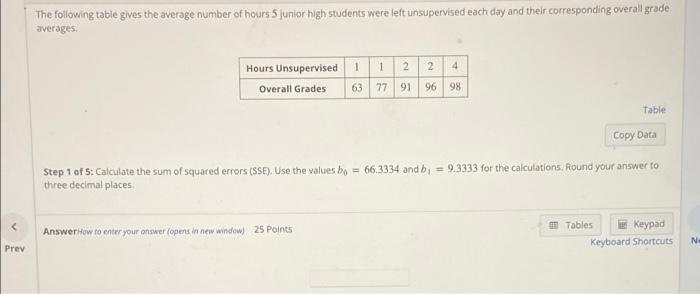
The following table gives the average number of hours 5 junior high students were left unsupervised each day and their corresponding overall grade averages 2 4 Hours Unsupervised 1 1 2 Overall Grades 63 77 91 96 98 Table Copy Data Step 1 of 5: Calculate the sum of squared errors (SSE). Use the values bo = 66,3334 and b. = 9.3333 for the calculations. Round your answer to three decimal places Answer How to enter your answer fopens in new window) 25 Points Tables ?E Keypad Keyboard Shortcuts N Prev
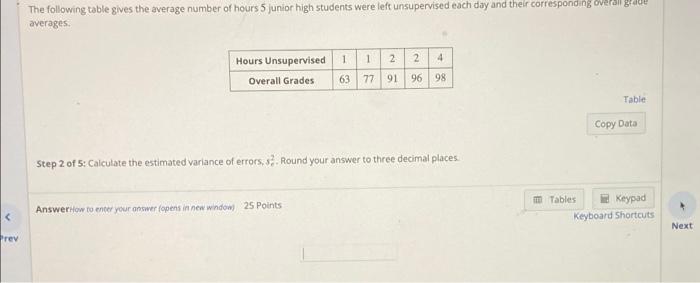
The following table gives the average number of hours 5 junior high students were left unsupervised each day and their corresponding overall averages 1 1 2 2 4 Hours Unsupervised Overall Grades 63 77 91 96 98 Table Copy Data Step 2 of 5: Calculate the estimated variance of errors, s. Round your answer to three decimal places Answer How to enter your answer fopens in new window) 25 Points im Tables EKeypad Keyboard Shortcuts < Next Prev
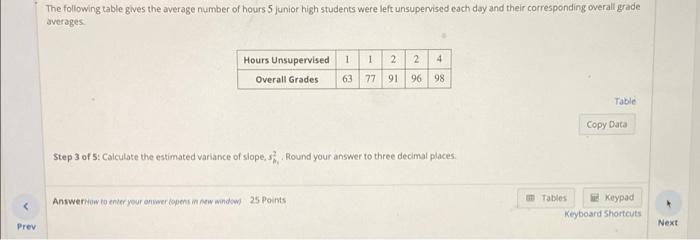
The following table gives the average number of hours 5 junior high students were left unsupervised each day and their corresponding overall grade averages 1 1 2 2 4 Hours Unsupervised Overall Grades 63 77 91 96 98 Table Copy Data Step 3 of 5: Calculate the estimated variance of slope Round your answer to three decimal places < Answerow to enter your owwer fopens in new window) 25 Points Tables in Keypad Keyboard Shortcuts Prev Next
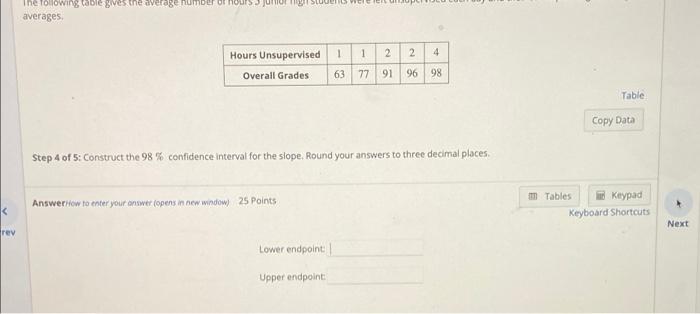
The following table gives the average number of averages 1 1 2 2 2 4 Hours Unsupervised Overall Grades 63 77 91 96 98 Table Copy Data Step 4 of 5: Construct the 98% confidence interval for the slope, Round your answers to three decimal places AnswerHow to enter your answer (opens in new window) 25 Points m Tables Keypad Keyboard Shortcuts < Next rev Lower endpoint Upper endpoint
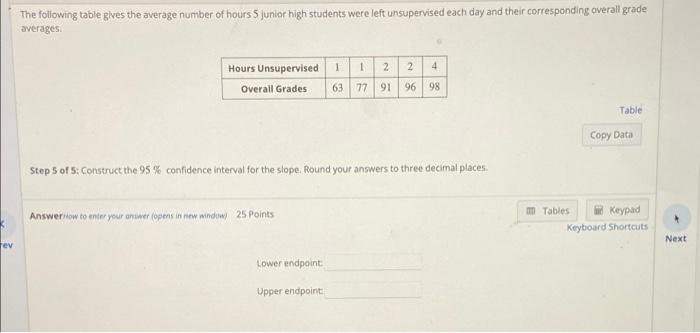
The following table gives the average number of hours 5 junior high students were left unsupervised each day and their corresponding overall grade averages Hours Unsupervised 1 1 Overall Grades 63 77 2 2 4 91 96 98 9 Table Copy Data Step 5 of 5: Construct the 95% confidence interval for the slope. Round your answers to three decimal places Answer low to enter your answer (Opens in new window) 25 Points Tables Keypad Keyboard Shortcuts Next rev Lower endpoint Upper endpoint
Expert Answer
1.The sum of squared errors = SSE = 351.333 2. Here