Home /
Expert Answers /
Statistics and Probability /
the-following-table-shows-the-height-of-the-plant-in-centimeters-by-weeks-since-planted-when-it-w-pa361
(Solved): The following table shows the height of the plant, in centimeters, by weeks since planted. When it w ...
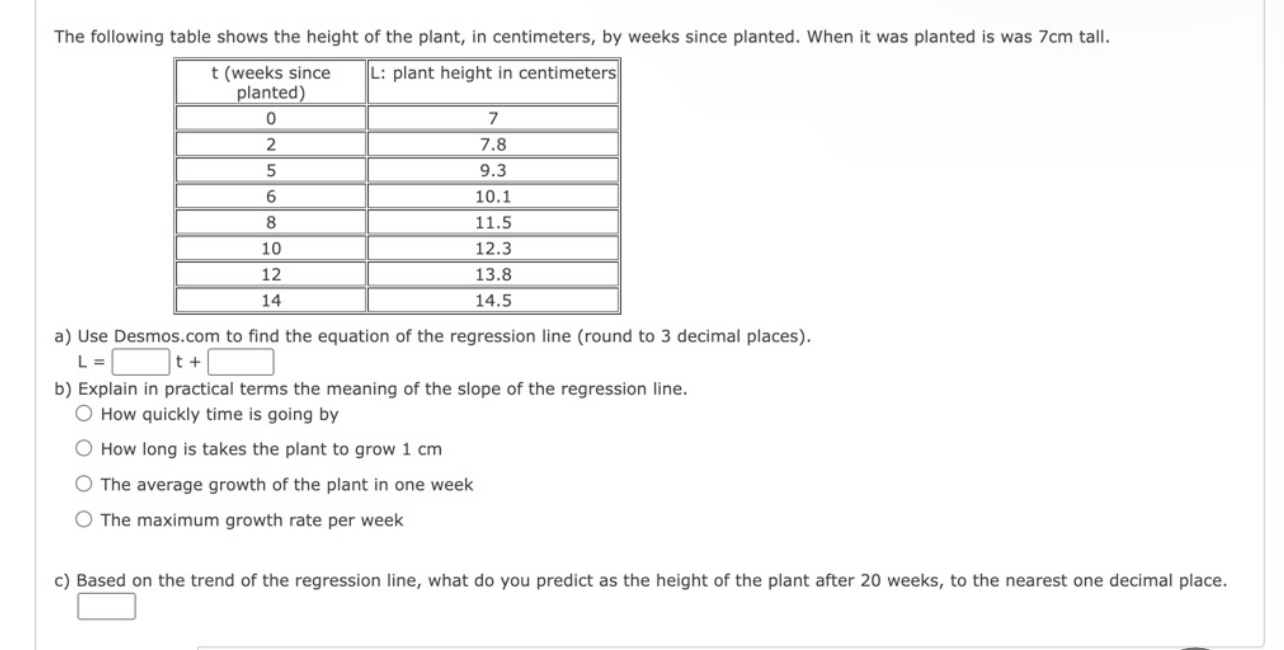
The following table shows the height of the plant, in centimeters, by weeks since planted. When it was planted is was
7cmtall. \table[[\table[[
t(weeks since],[planted)]],L: plant height in centimeters],[0,7],[2,7.8],[5,9.3],[6,10.1],[8,11.5],[10,12.3],[12,13.8],[14,14.5]] a) Use Desmos.com to find the equation of the regression line (round to 3 decimal places).
L=,t+b) Explain in practical terms the meaning of the slope of the regression line. How quickly time is going by How long is takes the plant to grow
1cmThe average growth of the plant in one week The maximum growth rate per week c) Based on the trend of the regression line, what do you predict as the height of the plant after 20 weeks, to the nearest one decimal place.