Home /
Expert Answers /
Economics /
the-graph-below-depicts-the-short-run-cost-curves-for-a-typical-fast-food-restaurant-in-a-mall-due-pa602
(Solved): The graph below depicts the short-run cost curves for a typical fast-food restaurant in a mall. Due ...
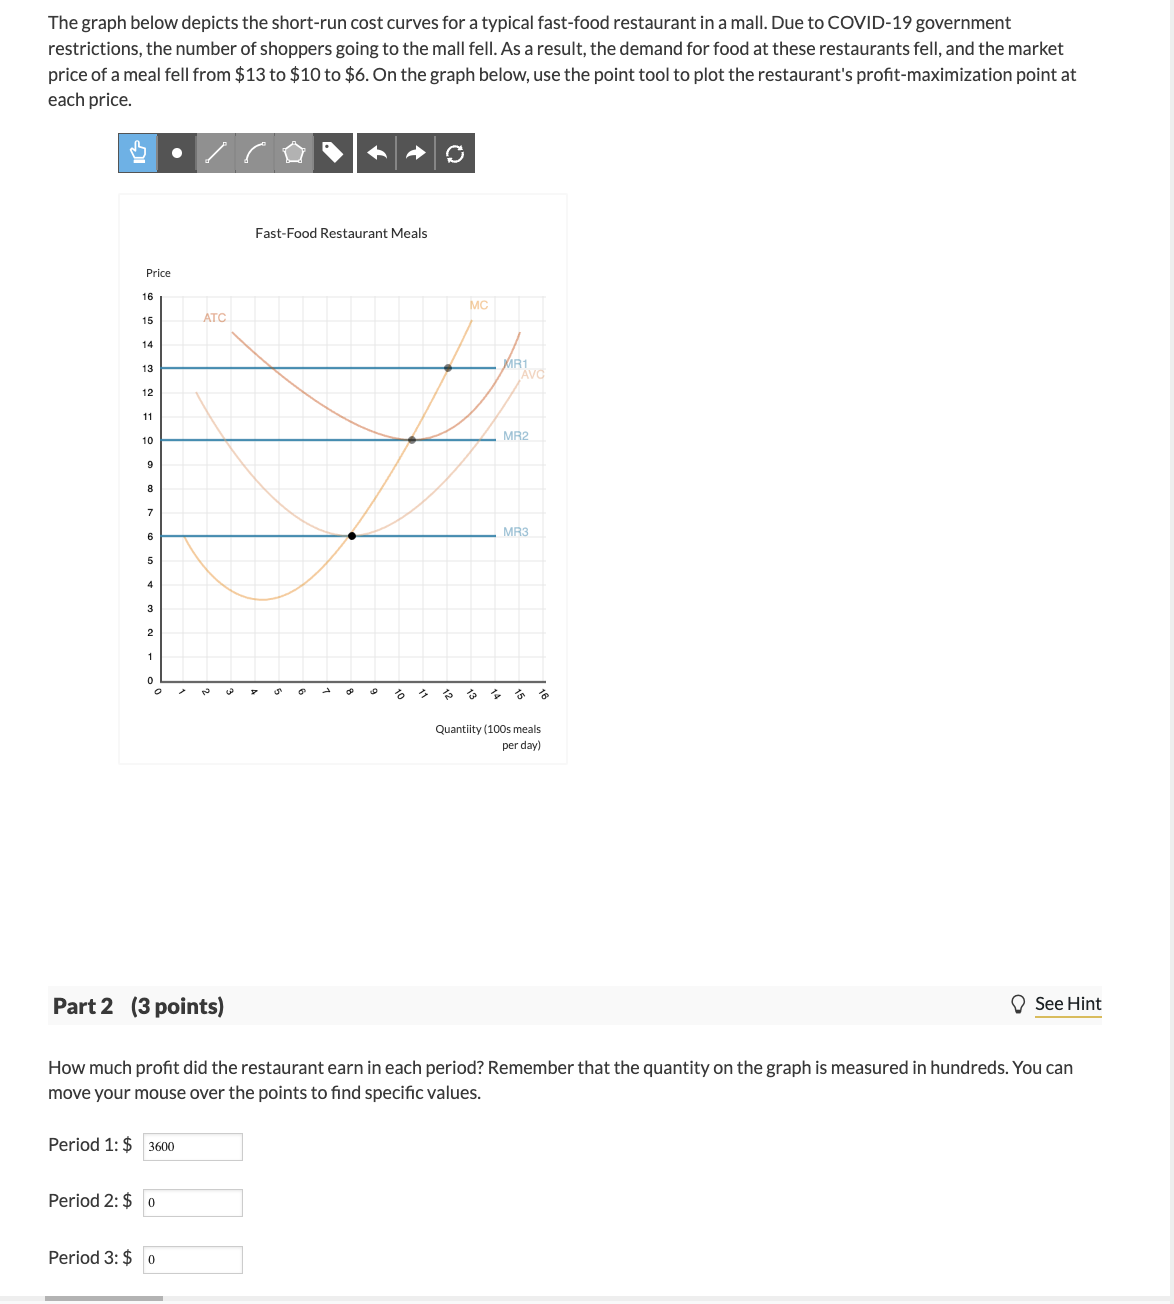
The graph below depicts the short-run cost curves for a typical fast-food restaurant in a mall. Due to COVID-19 government restrictions, the number of shoppers going to the mall fell. As a result, the demand for food at these restaurants fell, and the market price of a meal fell from to to . On the graph below, use the point tool to plot the restaurant's profit-maximization point at each price. Part 2 (3 points) See Hint How much profit did the restaurant earn in each period? Remember that the quantity on the graph is measured in hundreds. You can move your mouse over the points to find specific values. Period 1: \$ Period 2: \$ Period 3: \$