Home /
Expert Answers /
Chemical Engineering /
the-graph-below-is-an-arrhenius-plot-which-demonstrates-how-the-rate-constant-of-a-reaction-change-pa213
(Solved): The graph below is an Arrhenius plot which demonstrates how the rate constant of a reaction change ...
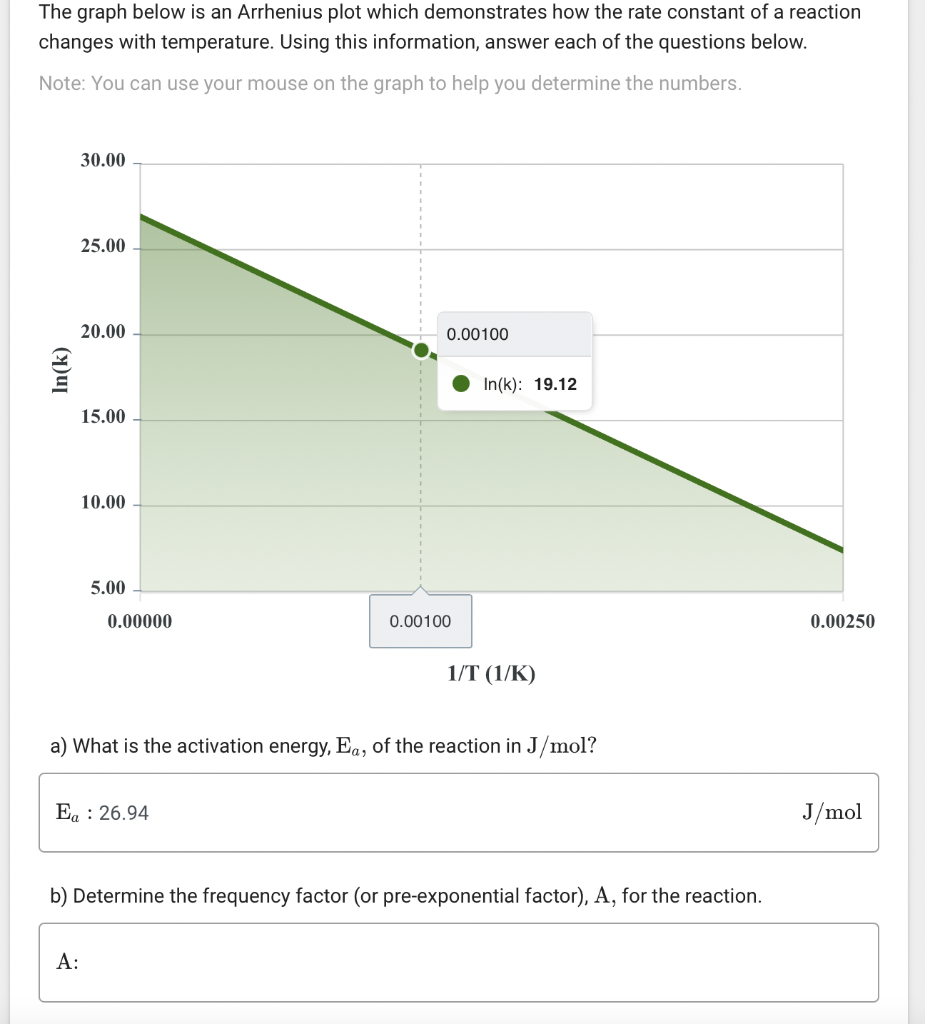
The graph below is an Arrhenius plot which demonstrates how the rate constant of a reaction changes with temperature. Using this information, answer each of the questions below. Note: You can use your mouse on the graph to help you determine the numbers. a) What is the activation energy, \( \mathrm{E}_{a} \), of the reaction in \( \mathrm{J} / \mathrm{mol} \) ? b) Determine the frequency factor (or pre-exponential factor), A, for the reaction.
c) Determine the value of the rate constant, \( \mathrm{k} \), for this reaction at a temperature of \( 235 \mathrm{~K} \).