Home /
Expert Answers /
Economics /
the-graph-depicts-the-market-for-loanable-funds-shift-the-appropriate-curves-to-indicate-what-will-pa347
(Solved): The graph depicts the market for loanable funds. Shift the appropriate curves to indicate what will ...
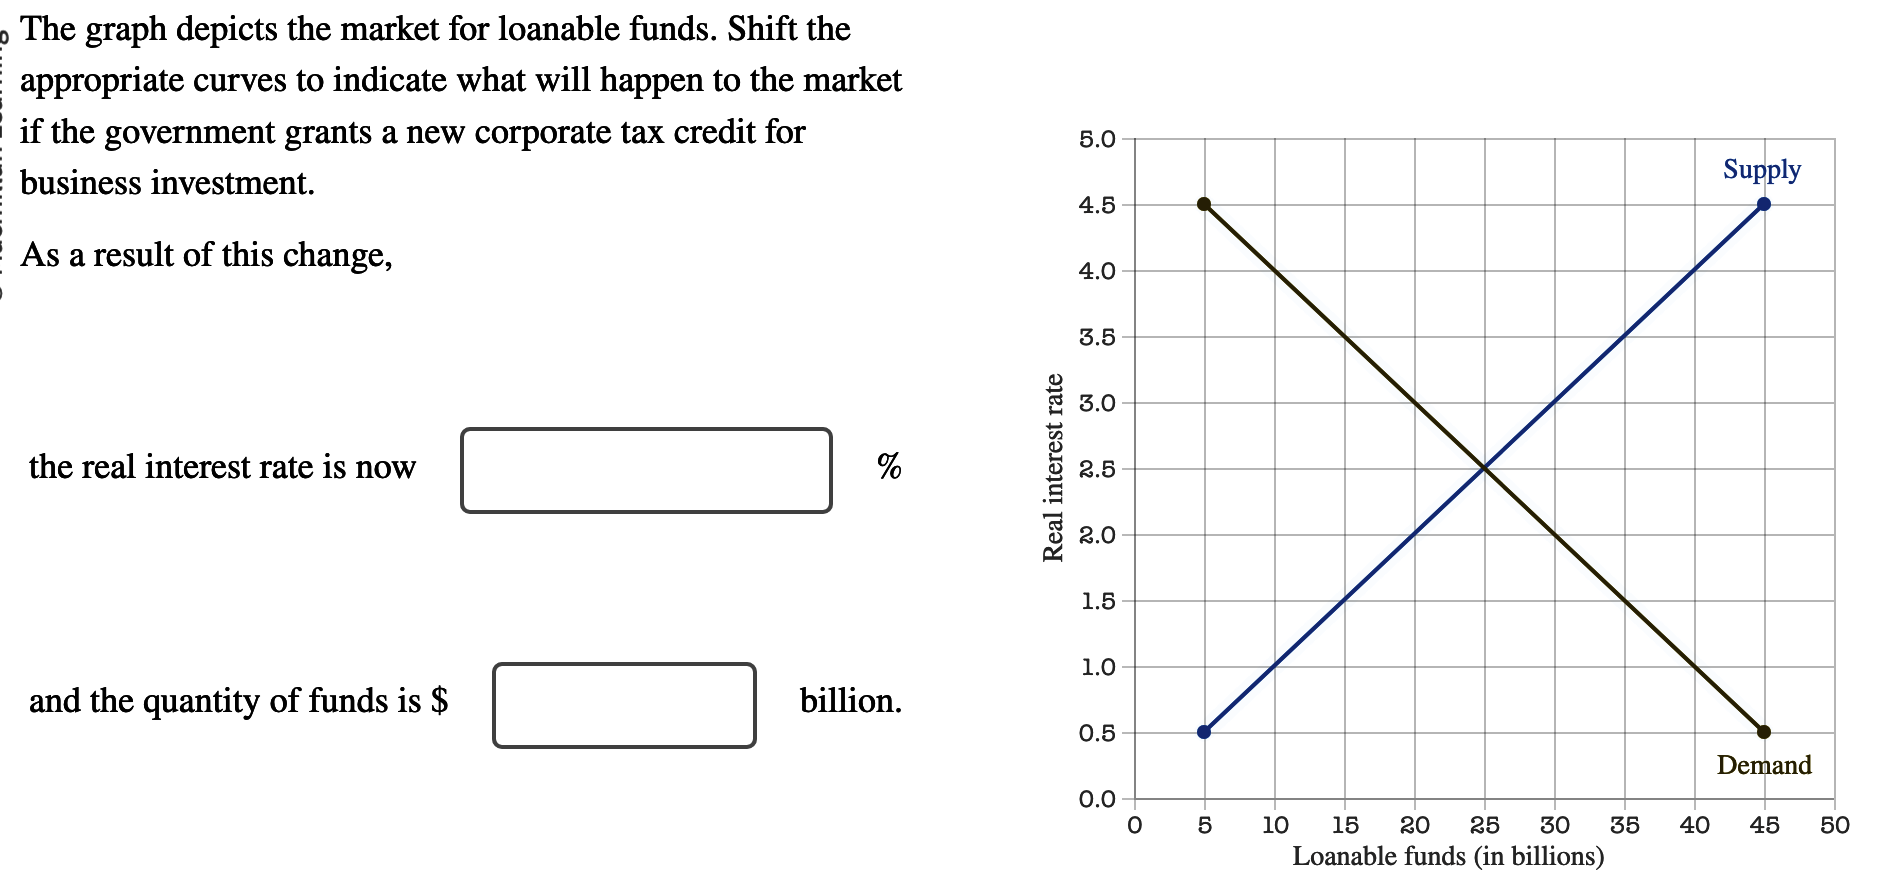
The graph depicts the market for loanable funds. Shift the appropriate curves to indicate what will happen to the market if the government grants a new corporate tax credit for business investment. As a result of this change, the real interest rate is now and the quantity of funds is billion.