Home /
Expert Answers /
Calculus /
the-graph-shows-the-displacement-time-history-for-the-rectilinear-motion-of-a-particle-during-an-8-pa841
(Solved): The graph shows the displacement-time history for the rectilinear motion of a particle during an 8 ...
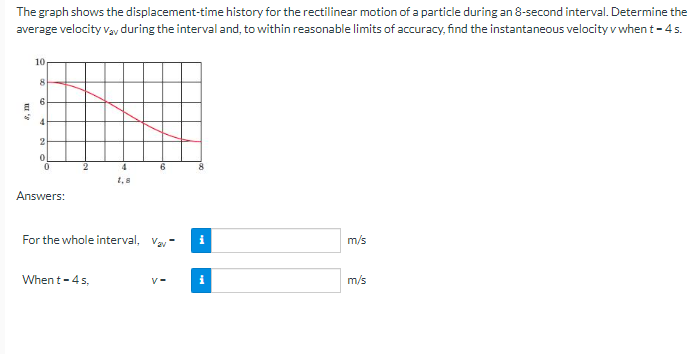
The graph shows the displacement-time history for the rectilinear motion of a particle during an 8 -second interval. Determine the average velocity \( v_{a v} \) during the interval and, to within reasonable limits of accuracy, find the instantaneous velocity \( v \) when \( t \) - 4 s. Answers: For the whole interval, \( v_{2} \) \( \mathrm{m} / 5 \) When \( t=4 s \), \( v= \) \( m / 5 \)