Home /
Expert Answers /
Mechanical Engineering /
the-graph-shows-the-emf-output-in-millivolts-of-a-thermocouple-as-a-function-of-temperature-when-the-pa553
(Solved): The graph shows the emf output in millivolts of a thermocouple as a function of temperature when the ...
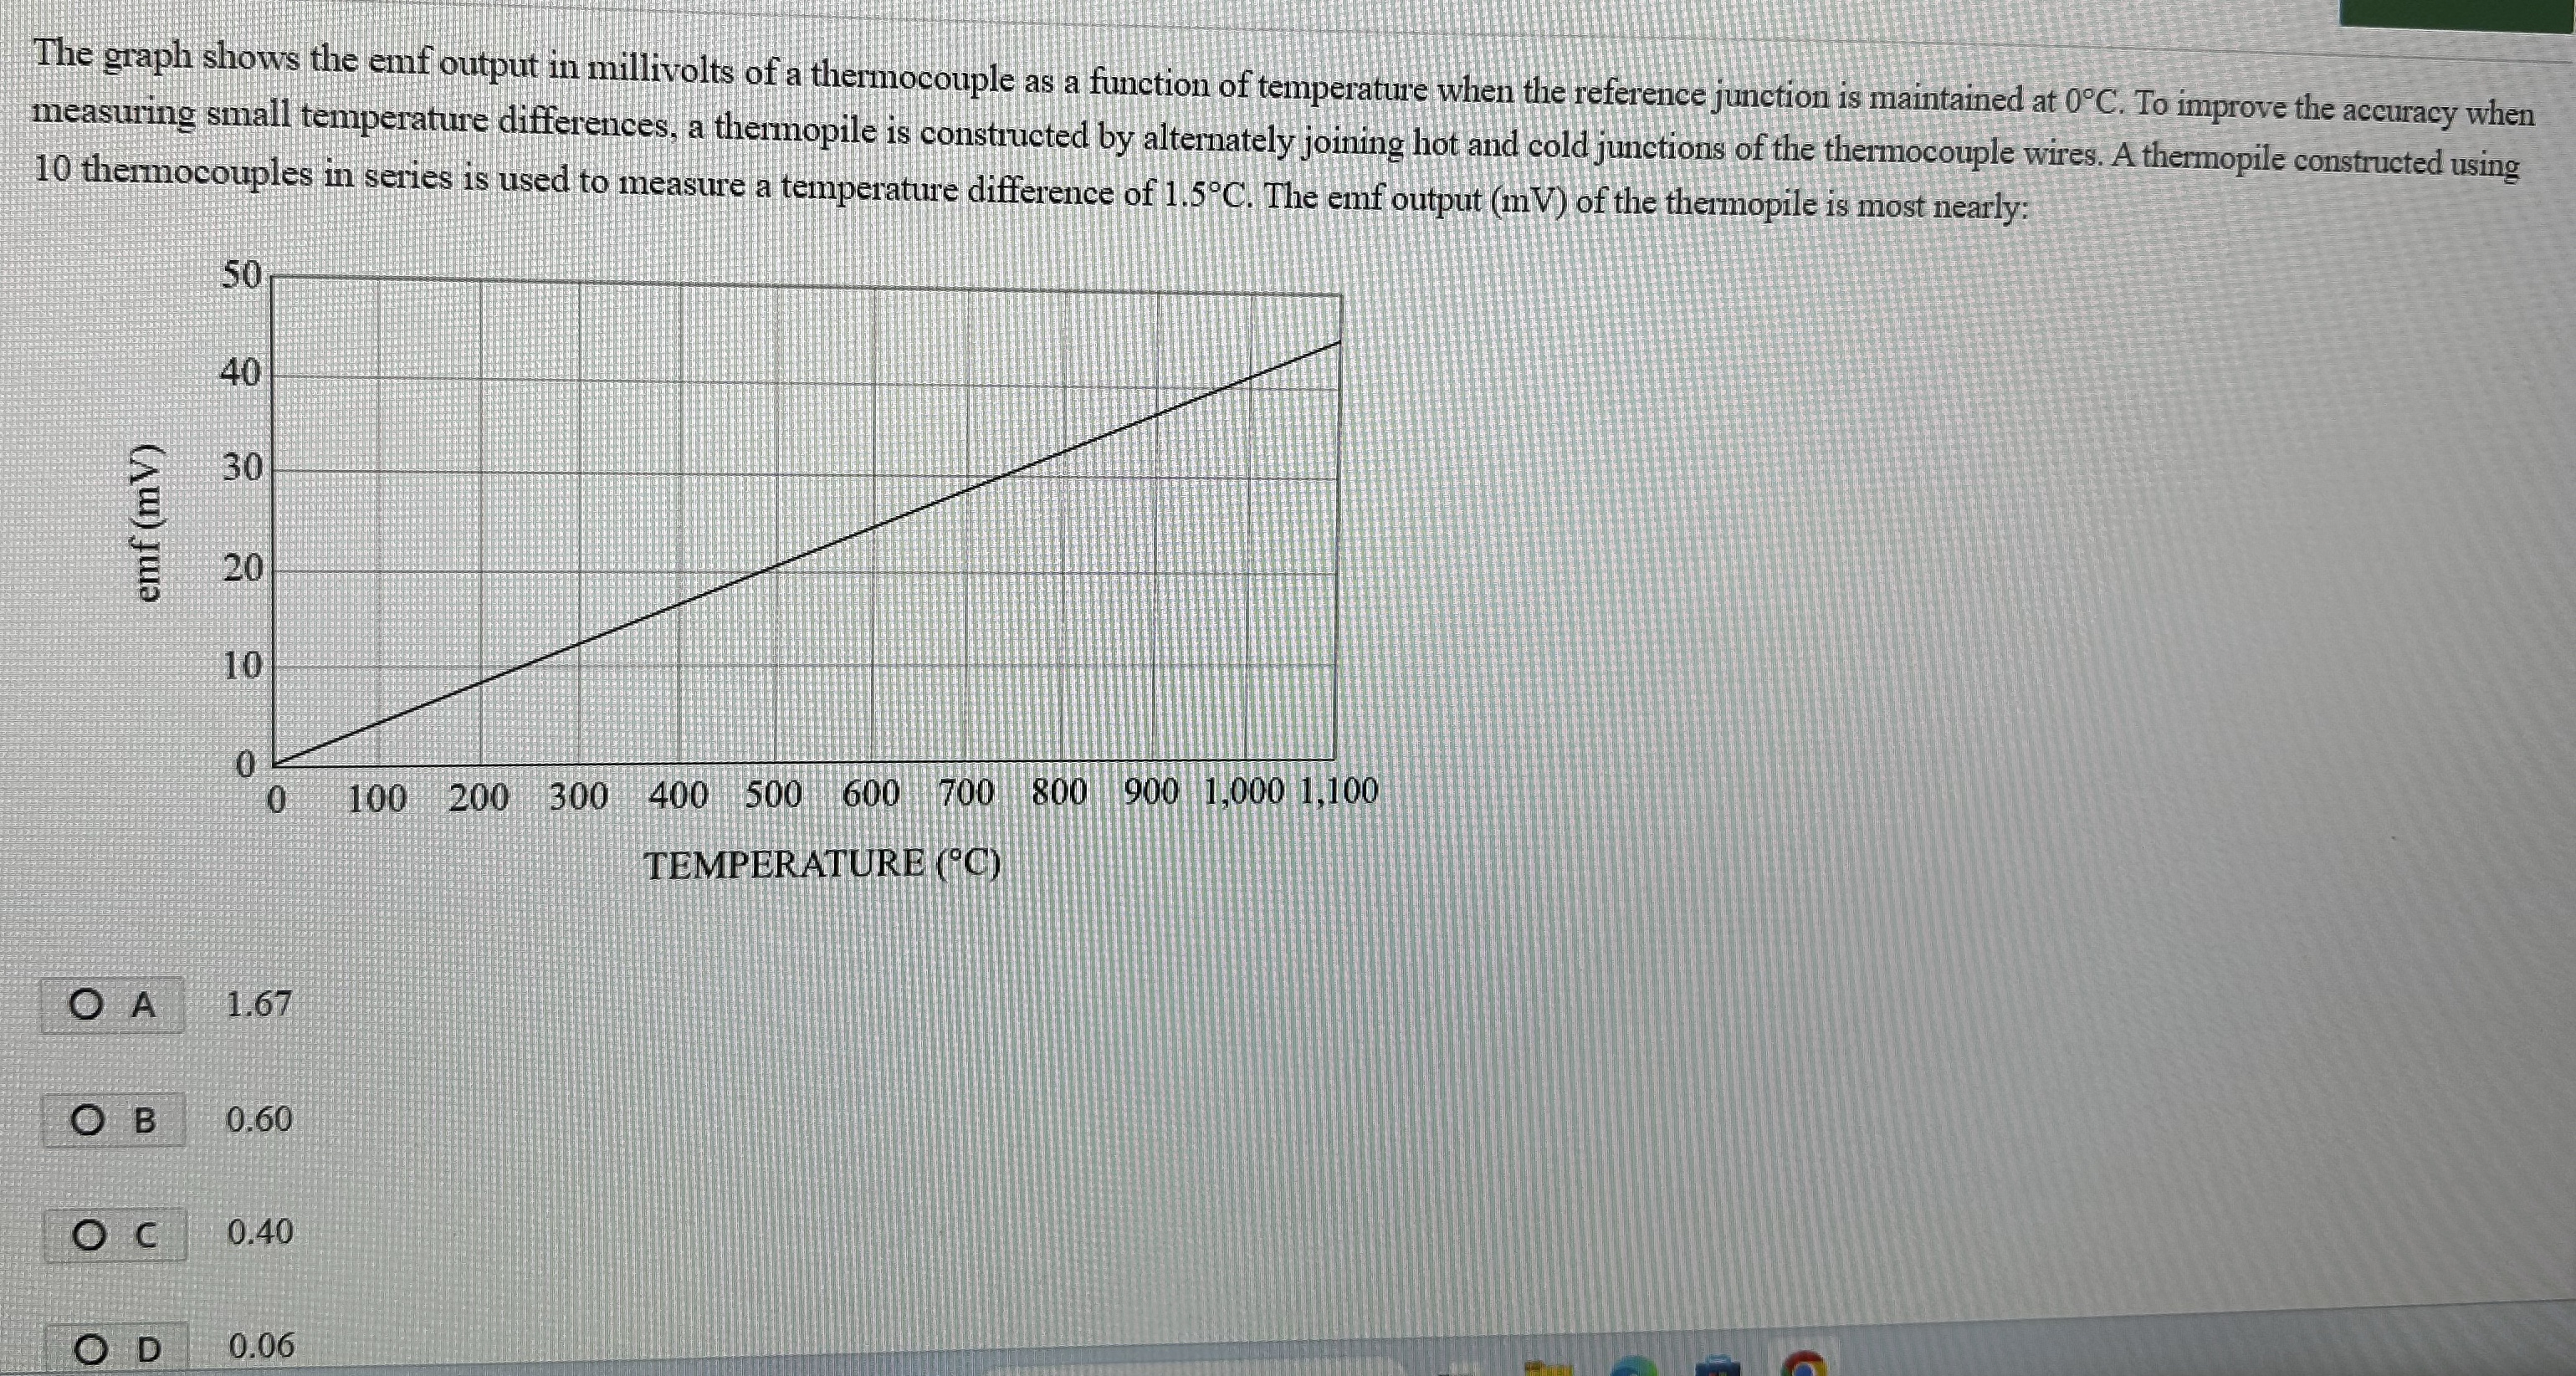
The graph shows the emf output in millivolts of a thermocouple as a function of temperature when the reference junction is maintained at
0\deg C. To improve the accuracy when measuring small temperature differences, a thermopile is constructed by alternately joining hot and cold junctions of the thermocouple wires. A thermopile constructed using 10 thermocouples in series is used to measure a temperature difference of
1.5\deg C. The emf output ( mV ) of the thermopile is most nearly: TEMPERATURE (
\deg C) A 1.67 B 0.60
◻0.40 D 0.06