Home /
Expert Answers /
Economics /
the-graph-to-the-right-depicts-the-demand-for-caffe-lattes-at-a-local-coffeehouse-along-with-the-ave-pa127
(Solved): The graph to the right depicts the demand for caffe lattes at a local coffeehouse along with the ave ...
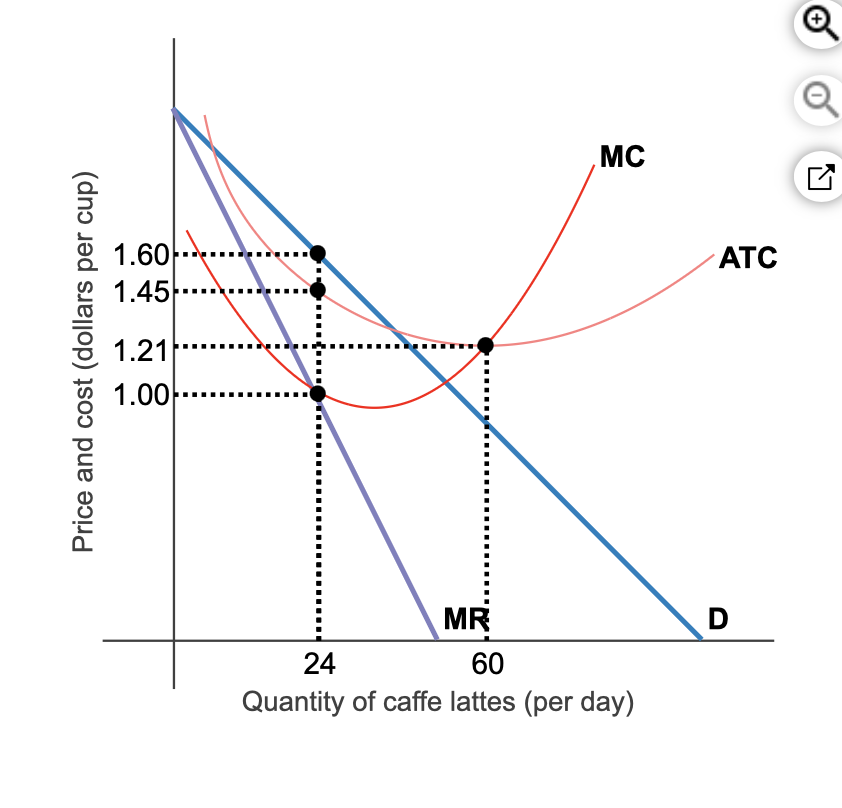
The graph to the right depicts the demand for caffe lattes at a local coffeehouse along with the average total cost and marginal cost of producing lattes.  Suppose the coffeehouse is in a monopolistically competitive market in the short run.
Part 2
How many caffe lattes should this coffeehouse produce to maximize  profits? 24 units.   (Enter a numeric response using an  integer.)
Part 3
What is the corresponding  profit-maximizing price?   $1.60 per latte.   (Enter a numeric response using a real number rounded to two decimal  places.)
Part 4
Calculate the  coffeehouse's profits on caffe lattes.