Home /
Expert Answers /
Statistics and Probability /
the-one-sample-z-test-a-lecture-course-has-900-students-broken-into-sections-of-30-students-each-pa457
(Solved): The One Sample z Test A lecture course has 900 students broken into sections of 30 students each. ...
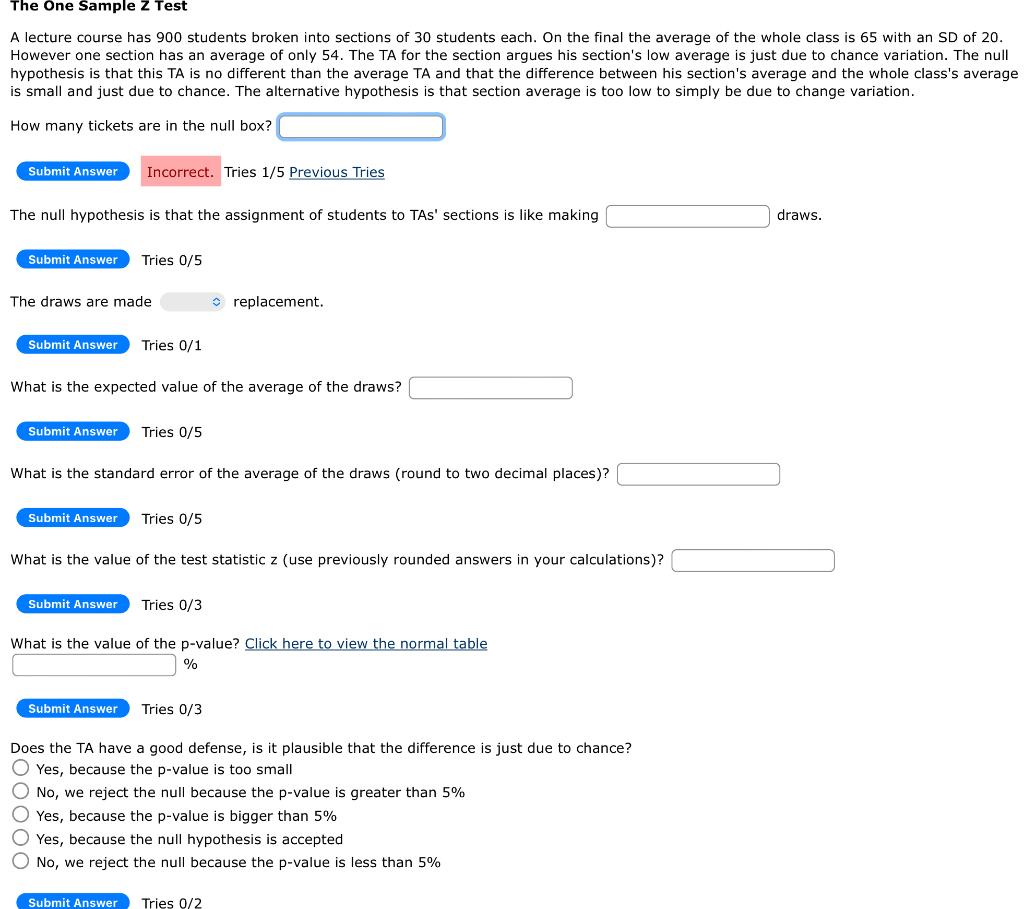
The One Sample z Test A lecture course has 900 students broken into sections of 30 students each. On the final the average of the whole class is 65 with an SD of 20. However one section has an average of only 54. The TA for the section argues his section's low average is just due to chance variation. The null hypothesis is that this TA is no different than the average TA and that the difference between his section's average and the whole class's average is small and just due to chance. The alternative hypothesis is that section average is too low to simply be due to change variation. How many tickets are in the null box? Submit Answer Incorrect. Tries 1/5 Previous Tries The null hypothesis is that the assignment of students to TAS' sections is like making draws. Submit Answer Tries 0/5 The draws are made replacement. Submit Answer Tries 0/1 What is the expected value of the average of the draws? Submit Answer Tries 0/5 What is the standard error of the average of the draws (round to two decimal places)? Submit Answer Tries 0/5 What is the value of the test statistic z (use previously rounded answers in your calculations)? Submit Answer Tries 0/3 What is the value of the p-value? Click here to view the normal table % Submit Answer Tries 0/3 Does the TA have a good defense, is it plausible that the difference is just due to chance? Yes, because the p-value is too small No, we reject the null because the p-value is greater than 5% Yes, because the p-value is bigger than 5% Yes, because the null hypothesis is accepted No, we reject the null because the p-value is less than 5% Submit Answer Tries 0/2
