Home /
Expert Answers /
Statistics and Probability /
the-pass-completion-percentages-of-10-college-football-quarterbacks-for-their-freshman-and-sophomor-pa417
(Solved): The pass completion percentages of 10 college football quarterbacks for their freshman and sophomor ...
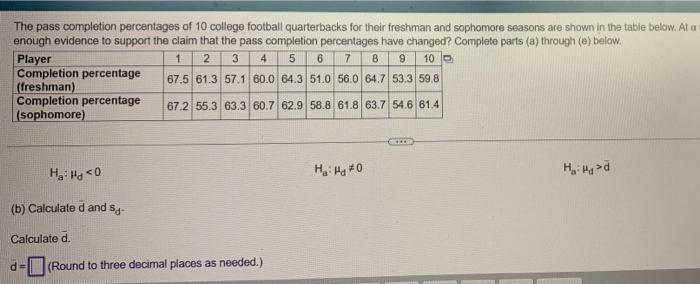
The pass completion percentages of 10 college football quarterbacks for their freshman and sophomore seasons are shown in the table below. Ata enough evidence to support the claim that the pass completion percentages have changed? Complete parts (a) through (e) below. Player 1 2 3 4 5 6 7 8 9 10 Completion percentage 67.5 61.3 57.1 60.0 64.3 51.0 56.0 64.7 53,3 59.8 (freshman) Completion percentage 672 55.3 63.3 60.7 62.9 58.8 61.8 63.7 54.6 61.4 (sophomore) Ha Ha 0 H:Hg70 Ho Hd (b) Calculate d and sa Calculate d. d-(Round to three decimal places as needed.)
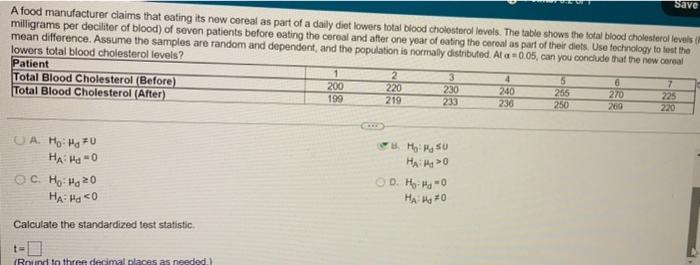
Save A food manufacturer claims that eating its new cereal as part of a daily diet lowers total blood cholesterol levels. The table shows the total blood cholesterol levels milligrams per deciliter of blood) of seven patients before eating the cereal and after one year of eating the cereal as part of their diets. Use technology to test the mean difference. Assume the samples are random and dependent, and the population is normally distributed. Al a=005, can you conclude that the new cereal lowers total blood cholesterol levels? Patient 2 Total Blood Cholesterol (Before) 5 200 220 230 240 256 270 Total Blood Cholesterol (After) 199 219 233 236 250 260 220 1 4 6 7 225 UA. Ho: MgO HAHOO oc. Ho Ho 20 Ha Ha < 0 Calculate the standardized test statistic HoH SU HA HO OD. Ho Hd 0 HA170 (Round to three decimal places as needed.)
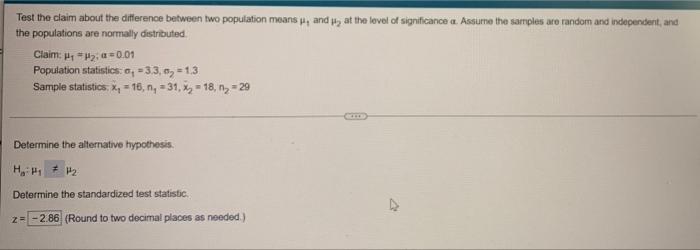
Test the claim about the difference between two population means, and i, at the level of significance a. Assure the samples are random and independent, and the populations are normally distributed Claim:H, a 0.01 Population statistics, -3.3,6 = 1,3 Sample statistics. x = 18, n. = 31, X = 18, ny = 29 Determine the alternative hypothesis. Determine the standardized test statistic z= -2.86 (Round to two decimal places as nooded)