Home /
Expert Answers /
Calculus /
the-rectangles-in-the-graph-below-illustrate-a-left-endpoint-riemann-sum-for-f-x-frac-x-2-pa173
(Solved): The rectangles in the graph below illustrate a left endpoint Riemann sum for \( f(x)-\frac{-x^{2}} ...
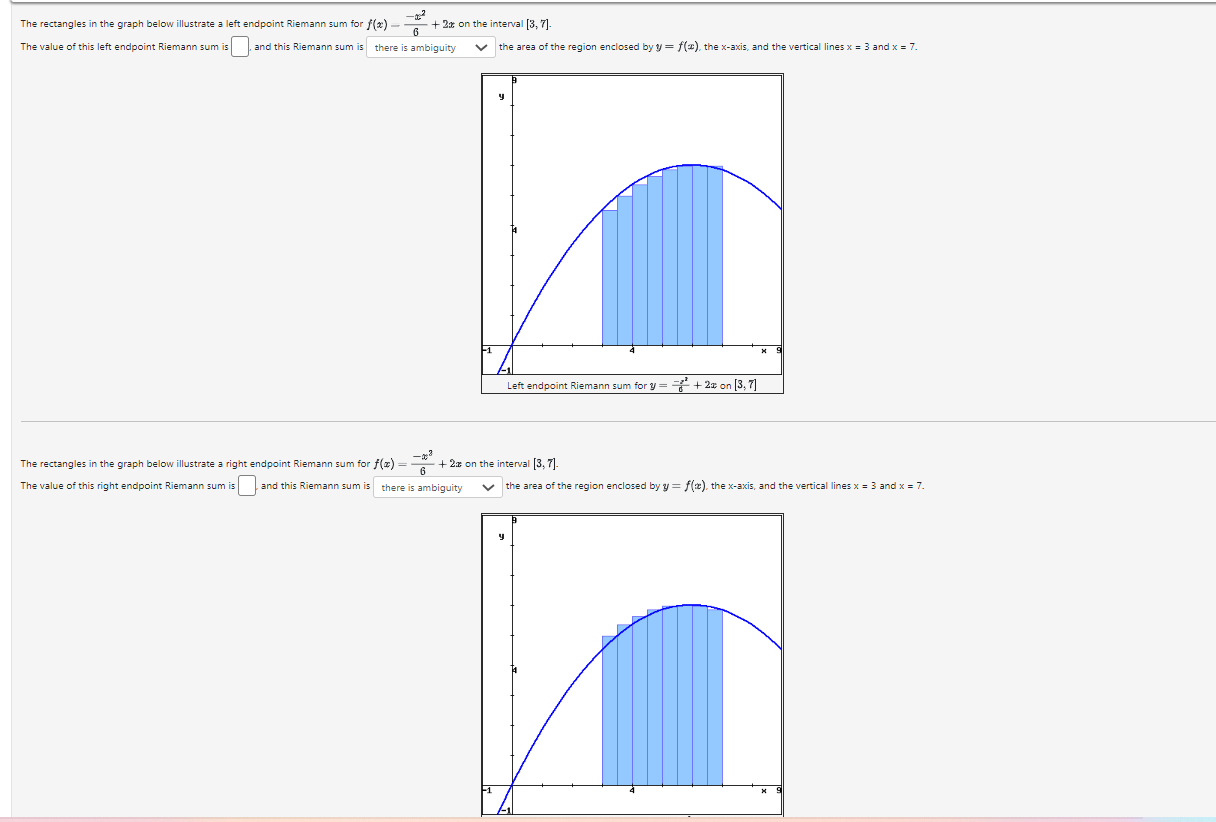
The rectangles in the graph below illustrate a left endpoint Riemann sum for \( f(x)-\frac{-x^{2}}{6}+2 x \) on the interval \( [3,7] \). The value of this left endpoint Riemann sum is and this Riemann sum is the area of the region enclosed by \( y=f(x) \), the \( x \)-axis, and the vertical lines \( x=3 \) and \( x=7 \). The rectangles in the graph below illustrate a right endpoint Riemann sum for \( f(x)=\frac{-x^{3}}{6}+2 x \) on the interval \( [3,7] \). The value of this right endpoint Riemann sum is and this Riemann sum is the area of the region enclosed by \( y=f(x) \), the \( x \)-axis, and the vertical lines \( x=3 \) and \( x=7 \).
Expert Answer
Solution Given that, The r