Home /
Expert Answers /
Operations Management /
the-table-above-shows-the-number-of-errors-in-a-computer-manufacturing-company-for-the-first-6-sampl-pa851
(Solved): The table above shows the number of errors in a computer manufacturing company for the first 6 sampl ...
The table above shows the number of errors in a computer manufacturing company for the first 6 samples. After sample 7 (100 units), the operations manager calculates the mean fraction defective in the sample ( p? ) as 0.06? What is the fraction defective for sample 7?
0.05
0.08
0.02
1
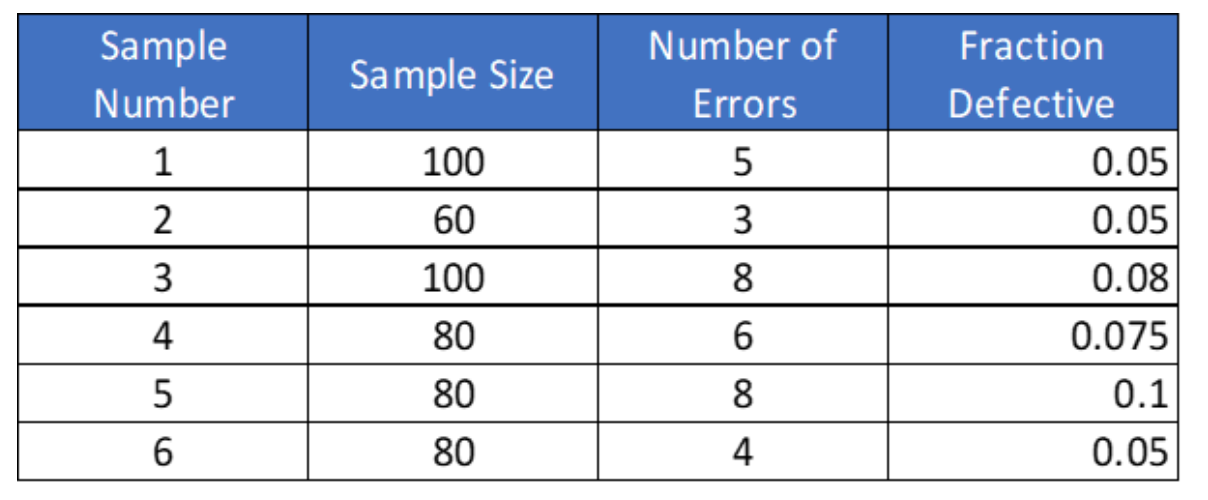
\begin{tabular}{|c|c|c|r|} \hline Sample Number & Sample Size & Number of Errors & Fraction Defective \\ \hline 1 & 100 & 5 & \( 0.05 \) \\ \hline 2 & 60 & 3 & \( 0.05 \) \\ \hline 3 & 100 & 8 & \( 0.08 \) \\ \hline 4 & 80 & 6 & \( 0.075 \) \\ \hline 5 & 80 & 8 & \( 0.1 \) \\ \hline 6 & 80 & 4 & \( 0.05 \) \\ \hline \end{tabular}
Expert Answer
Given that Mean of fraction defective (p) = 0.06 Total no. of samples = 7 Sample size of sample no. 7 = 100 units