(Solved): The table below shows the demand and supply schedules for the low-skilled labor market in the city ...
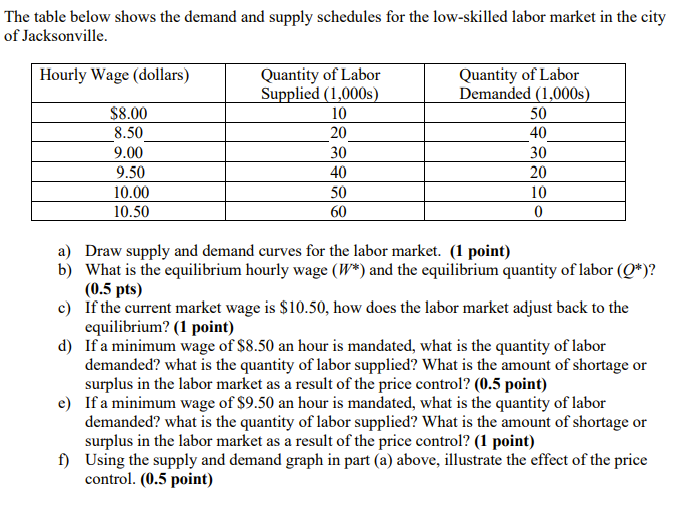
The table below shows the demand and supply schedules for the low-skilled labor market in the city of Jacksonville. a) Draw supply and demand curves for the labor market. (1 point) b) What is the equilibrium hourly wage
(W^(*))and the equilibrium quantity of labor
(Q^(*))? ( 0.5 pts) c) If the current market wage is
$10.50, how does the labor market adjust back to the equilibrium? (1 point) d) If a minimum wage of
$8.50an hour is mandated, what is the quantity of labor demanded? what is the quantity of labor supplied? What is the amount of shortage or surplus in the labor market as a result of the price control? ( 0.5 point) e) If a minimum wage of
$9.50an hour is mandated, what is the quantity of labor demanded? what is the quantity of labor supplied? What is the amount of shortage or surplus in the labor market as a result of the price control? (1 point) f) Using the supply and demand graph in part (a) above, illustrate the effect of the price control. ( 0.5 point)