Home /
Expert Answers /
Statistics and Probability /
the-table-to-the-right-gives-data-on-a-survey-of-the-number-of-times-married-for-men-of-age-20-to-2-pa265
(Solved): The table to the right gives data on a survey of the number of times married for men of age 20 to 2 ...
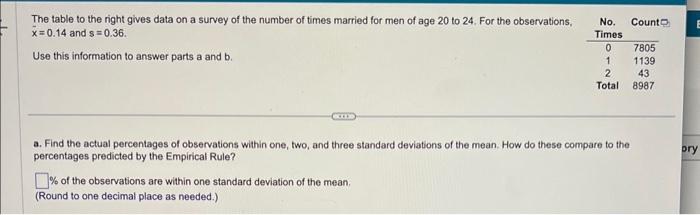
The table to the right gives data on a survey of the number of times married for men of age 20 to 24 . For the observations, and Use this information to answer parts and . a. Find the actual percentages of observations within one, two, and three standard deviations of the mean. How do these compare to the percentages predicted by the Empirical Rule? of the observations are within one standard deviation of the mean. (Round to one decimal place as needed.)
Expert Answer
Solution:-Given data,For the obse