Home /
Expert Answers /
Statistics and Probability /
the-two-columns-table-given-below-represents-data-collected-from-an-experiment-1-fit-straight-line-pa889
(Solved): The two columns table given below represents data collected from an experiment. 1. Fit straight line ...
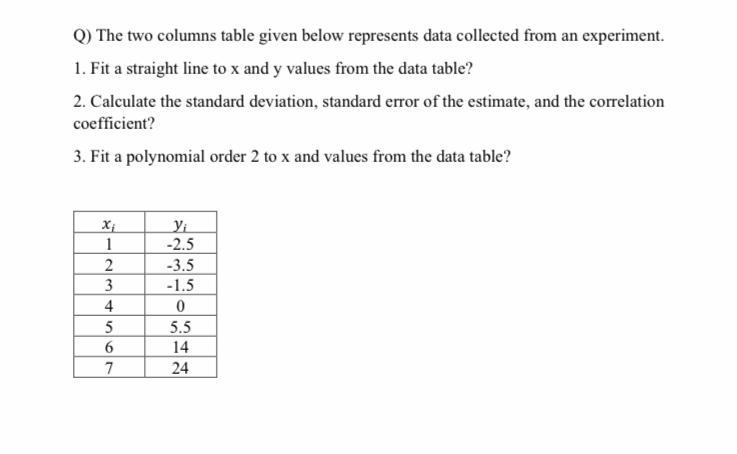
The two columns table given below represents data collected from an experiment.
1. Fit straight line to x and y values from the data table?
2. Calculate the standard deviation, standard error of the estimate, and the correlation coefficient?
3. Fit a polynomial order 2 to x and y values from the data table?
| xi | yi |
| 1 | -2.5 |
| 2 | -3.5 |
| 3 | -1.5 |
| 4 | 0 |
| 5 | 5.5 |
| 6 | 14 |
| 7 | 24 |
Q) The two columns table given below represents data collected from an experiment. 1. Fit a straight line to x and y values from the data table? 2. Calculate the standard deviation, standard error of the estimate, and the correlation coefficient? 3. Fit a polynomial order 2 to x and values from the data table? X? Yi 1 -2.5 2 -3.5 3 -1.5 4 0 5 5.5 6 14 7 24