Home /
Expert Answers /
Chemistry /
this-graph-shows-how-the-vapor-pressure-of-three-liquids-varies-with-temperature-nbsp-pa541
(Solved): This graph shows how the vapor pressure of three liquids varies with temperature: ...
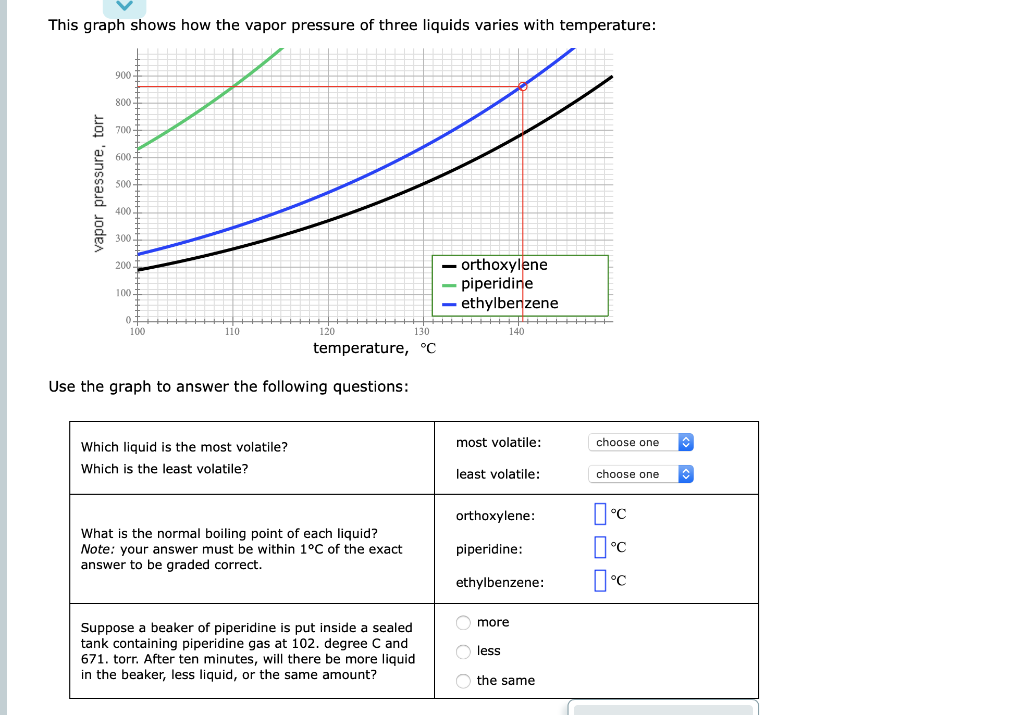
This graph shows how the vapor pressure of three liquids varies with temperature:
| Which liquid is the most volatile? | most volatile: | choose oneorthoxylenepiperidineethylbenzene |
|
Which is the least volatile? |
What is the normal boiling point of each liquid?
Note: your answer must be within 1°C of the exact answer to be graded correct.
Suppose a beaker of piperidine is put inside a sealed tank containing piperidine gas at 102. degree C and 671. torr. After ten minutes, will there be more liquid in the beaker, less liquid, or the same amount?
This graph shows how the vapor pressure of three liquids varies with temperature: Use the graph to answer the following questions: