(Solved): this is organic chemistry 2 Question: The NMR spectrum is provided:You can download the 1H NMR by c ...
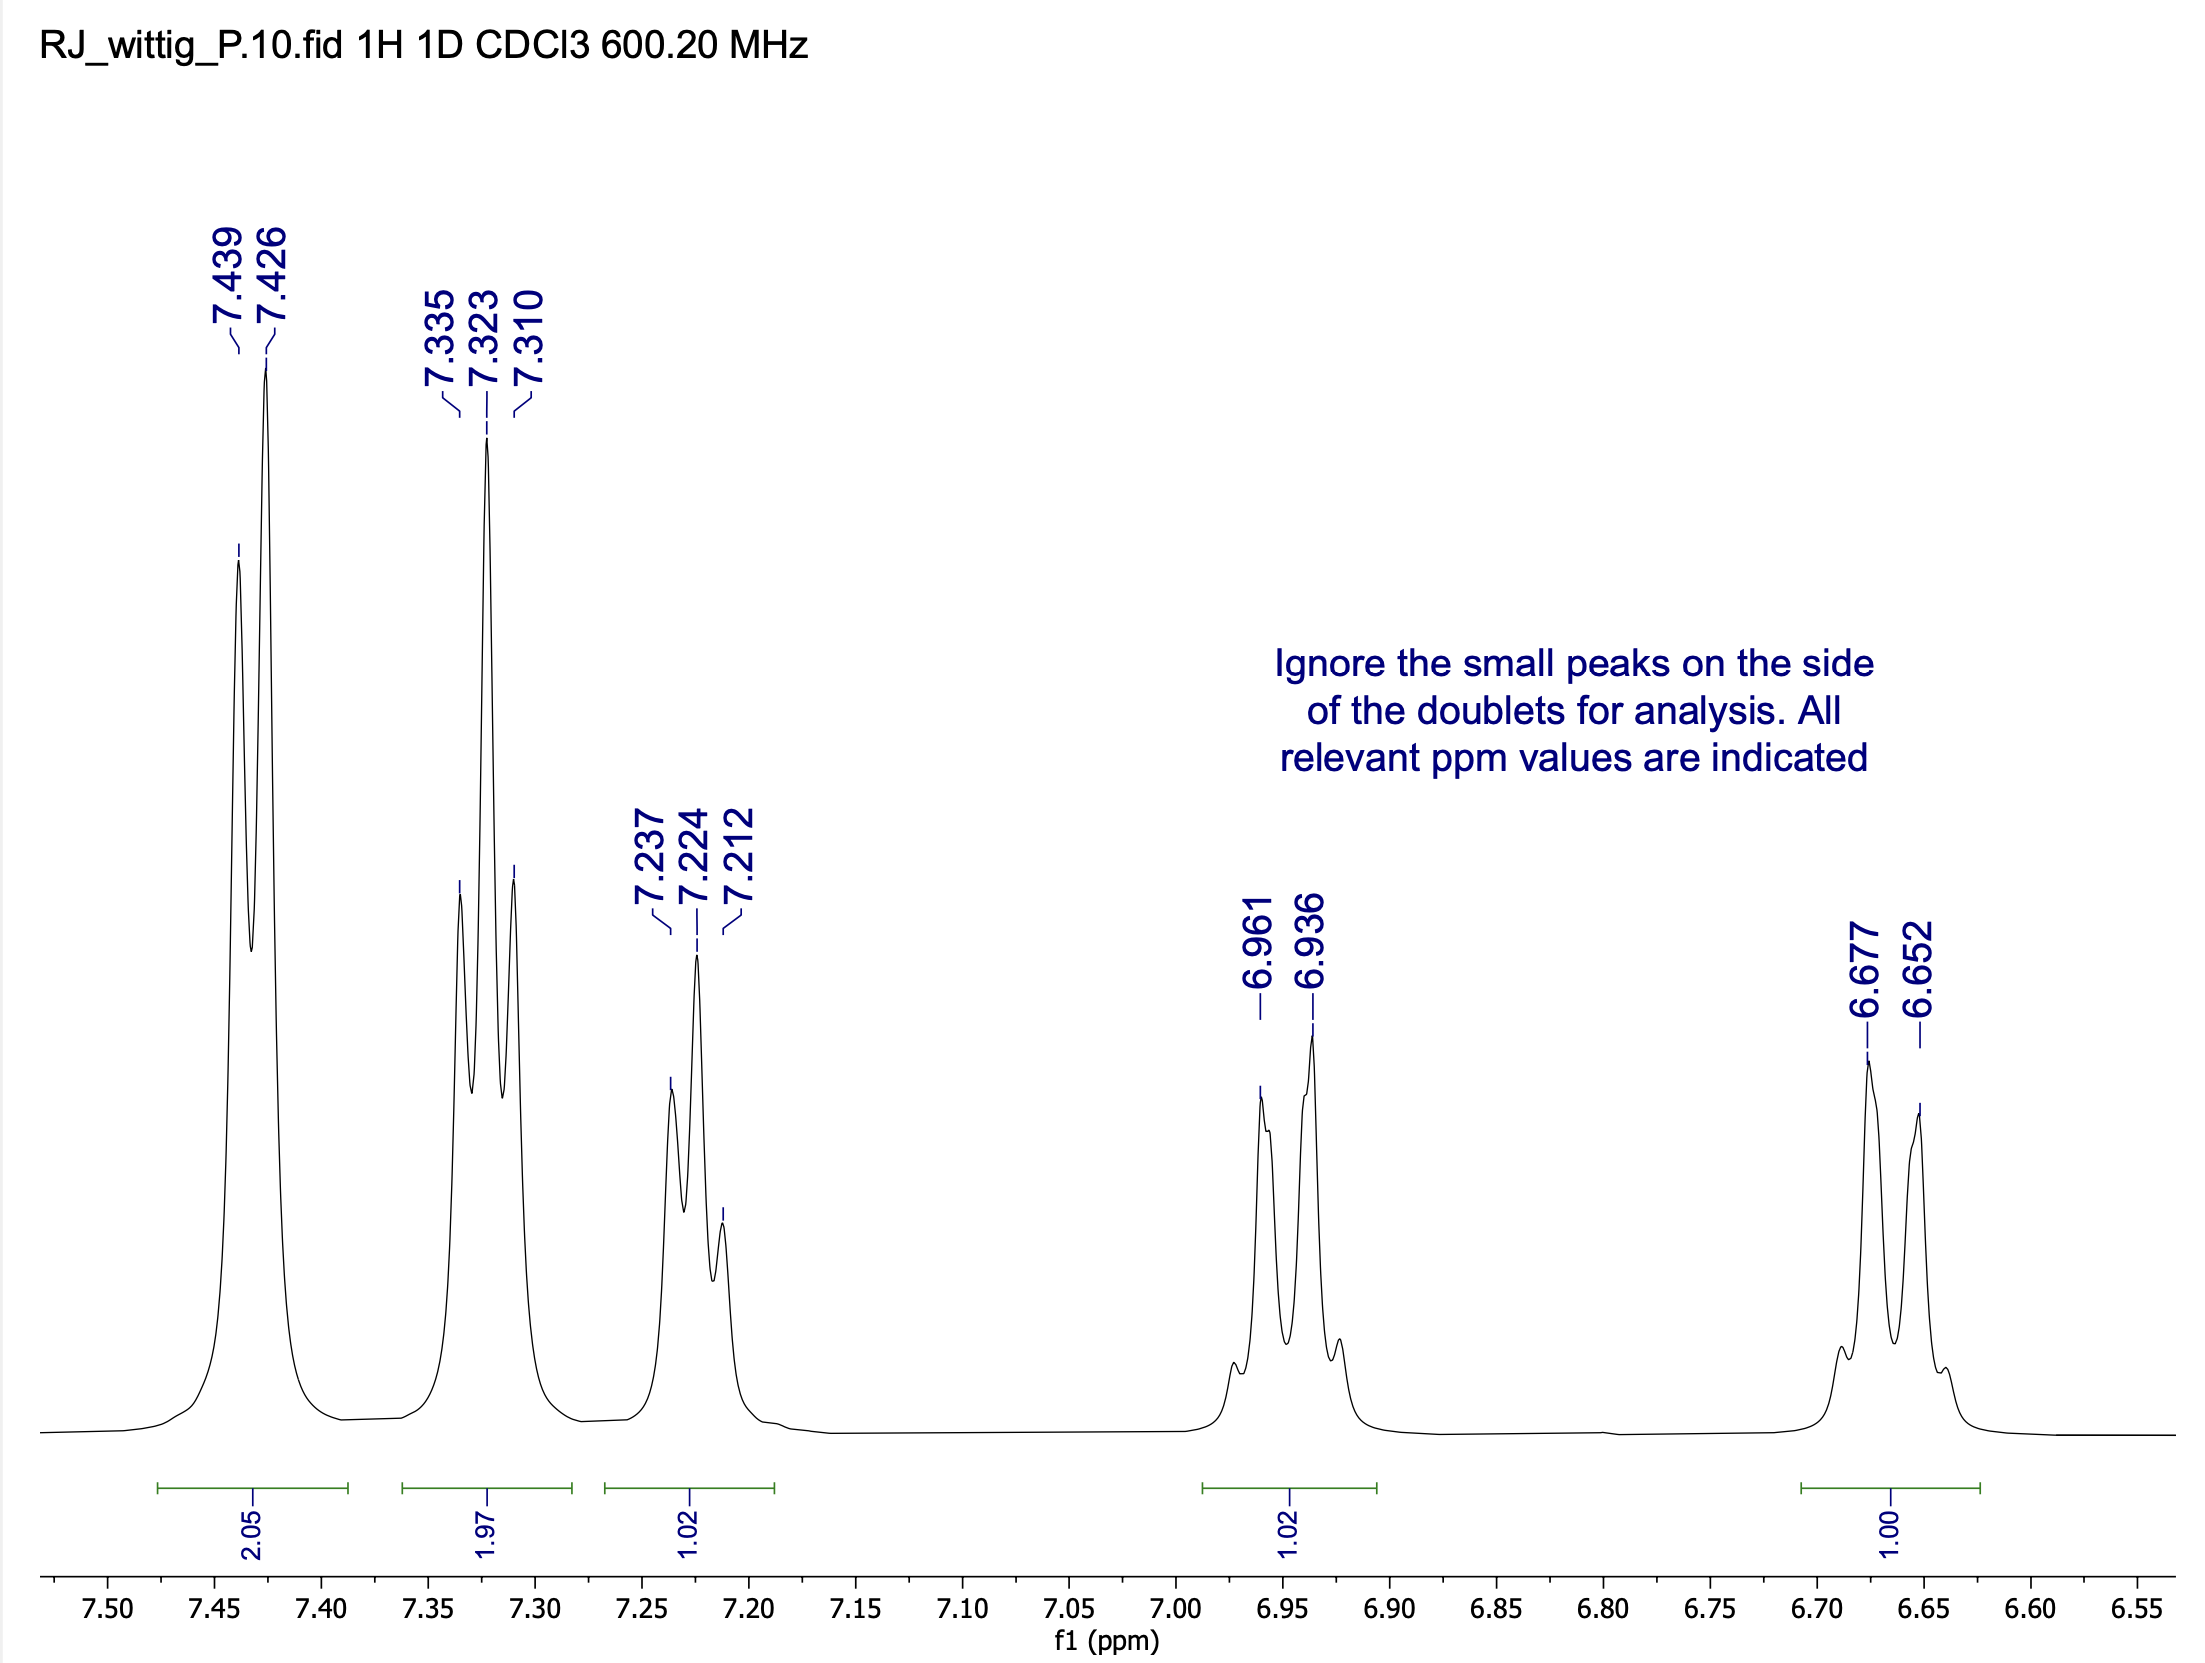
this is organic chemistry 2 Question: The NMR spectrum is provided:You can download the 1H NMR by clicking here. Please note the upfield signals on that spectrum are, for your analysis, simple doublets. All relevant chemical shift values are indicated by the blue labels in ppm. The relative integration of the peaks is indicated under the peaks by the green bracket. The NMR spectrum was taken on a 600 MHz NMR Spectrometer for increased resolution. Print the spectrum and do the following analysis: Label each peak with the following information: chemical shift, multiplicity, integration, coupling constant. The format should be X.XX ppm ([multiplicity], XH, J = X.X Hz), as taught in class. Determine if the cis,trans or trans,trans isomer was isolated. Justify your answer. Draw the correct isomer on the spectrum, showing its different 1H environments. Assign each of these 1H environments a letter (A, B, C...) Assign the peaks on the spectrum to the hydrogens they correspond to, by assigning each peak a letter label (i.e.: peak A corresponding to HA, etc.) Upload your spectrum with the analysis written on it. RJ_wittig_P.10.fid 1H 1D CDCl3 600.20 MHz