Home /
Expert Answers /
Mechanical Engineering /
use-matlab-for-plotting-a-1-d-slab-0-leq-x-leq-l-is-initially-at-a-temperature-t-1-pa757
(Solved): Use matlab for plotting A 1-D slab, \( 0 \leq x \leq L \), is initially at a temperature \( T_{1} ...
Use matlab for plotting
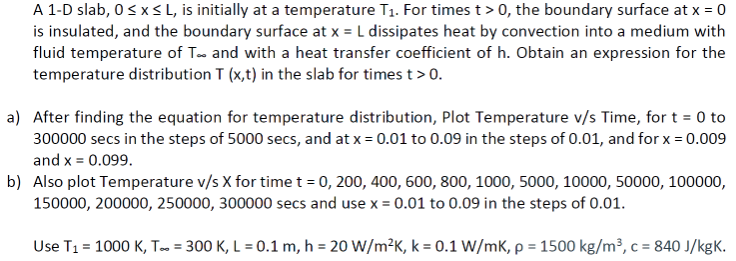
A 1-D slab, \( 0 \leq x \leq L \), is initially at a temperature \( T_{1} \). For times \( t>0 \), the boundary surface at \( x=0 \) is insulated, and the boundary surface at \( \mathrm{x}=\mathrm{L} \) dissipates heat by convection into a medium with fluid temperature of \( T_{\infty} \) and with a heat transfer coefficient of \( h \). Obtain an expression for the temperature distribution \( \mathrm{T}(\mathrm{x}, \mathrm{t}) \) in the slab for times \( t>0 \). After finding the equation for temperature distribution, Plot Temperature \( \mathrm{v} / \mathrm{s} \) Time, for \( \mathrm{t}=0 \) to 300000 secs in the steps of 5000 secs, and at \( x=0.01 \) to \( 0.09 \) in the steps of \( 0.01 \), and for \( x=0.009 \) and \( x=0.099 \). Also plot Temperature \( v / s \mathrm{X} \) for time \( t=0,200,400,600,800,1000,5000,10000,50000,100000 \), \( 150000,200000,250000,300000 \) secs and use \( x=0.01 \) to \( 0.09 \) in the steps of \( 0.01 \). Use \( T_{1}=1000 \mathrm{~K}, T_{\infty}=300 \mathrm{~K}, \mathrm{~L}=0.1 \mathrm{~m}, \mathrm{~h}=20 \mathrm{~W} / \mathrm{m}^{2} \mathrm{~K}, \mathrm{k}=0.1 \mathrm{~W} / \mathrm{mK}, \rho=1500 \mathrm{~kg} / \mathrm{m}^{3}, \mathrm{c}=840 \mathrm{~J} / \mathrm{kgK} \).
Expert Answer
Here's Your Answer Solution In order to answer this question, we can use the lu