Home /
Expert Answers /
Calculus /
use-the-graph-of-the-function-f-given-below-to-answer-the-list-the-values-of-x-at-which-pa647
(Solved): Use the graph of the function \( f \) given below to answer the List the values of \( x \) at which ...
![Determine algebraically whether the given function is even, odd, or neither.
\[
f(x)=-3 x^{3}-6 x
\]
Neither
Even
Odd](https://media.cheggcdn.com/study/0d6/0d67e477-15bd-4d51-b631-3fe197eaaaf0/image)
![Determine algebraically whether the given function is even, odd, or neither.
\[
g(x)=6 x^{3}+7
\]
Odd
Even
Neither](https://media.cheggcdn.com/study/0b8/0b85b657-5850-4ed2-a58d-14b9ad2972c6/image)
![Determine algebraically whether the given function is even, odd, or neither.
\[
f(x)=5 x^{2}+|3 x|
\]
Neither
Even
Odd](https://media.cheggcdn.com/study/da9/da97debf-4d2a-460e-82e5-f8d1d5c06543/image)
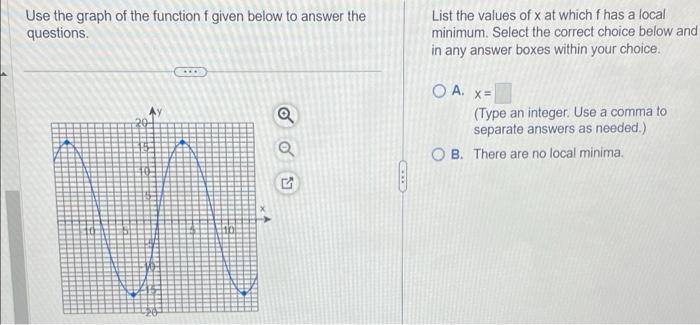
Use the graph of the function \( f \) given below to answer the List the values of \( x \) at which \( f \) has a local questions. minimum. Select the correct choice below and in any answer boxes within your choice. A. \( x= \) (Type an integer. Use a comma to separate answers as needed.) B. There are no local minima.
Determine algebraically whether the given function is even, odd, or neither. \[ f(x)=-3 x^{3}-6 x \] Neither Even Odd
Determine algebraically whether the given function is even, odd, or neither. \[ g(x)=6 x^{3}+7 \] Odd Even Neither
Determine algebraically whether the given function is even, odd, or neither. \[ f(x)=5 x^{2}+|3 x| \] Neither Even Odd
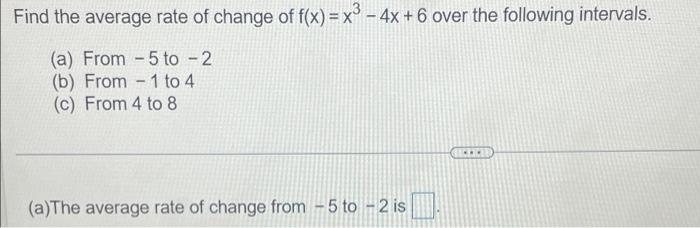
Find the average rate of change of \( f(x)=x^{3}-4 x+6 \) over the following intervals. (a) From - 5 to \( -2 \) (b) From \( -1 \) to 4 (c) From 4 to 8 (a)The average rate of change from \( -5 \) to \( -2 \) is
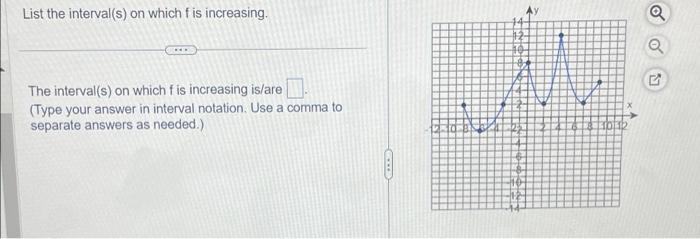
List the interval(s) on which \( f \) is increasing. The interval(s) on which \( f \) is increasing is/are (Type your answer in interval notation. Use a comma to separate answers as needed.)
Expert Answer
1) From the graph we can see that f has a