Home /
Expert Answers /
Chemistry /
using-a-spectroscope-nbsp-use-the-images-provided-below-drawing-of-fluorescent-light-incandescent-pa351
(Solved): Using a spectroscope use the images provided below? drawing of fluorescent light? incandescent ...
Using a spectroscope
use the images provided below? drawing of fluorescent light? incandescent light? can someone please exaim what i need to do here step by step
How will you collect data for this experiment? virtually Which three gas discharge tubes did you observe in lab? Discharge tube \( =1 \) Discharge tube \( * 2 \) Discharge tube \( \pi 3 \) (20pts) Part A. Using a Spectroscope From the procedure 1. Looking at your handheld spectroscope, locate each of the labeled parts shown in Figure SP 4 in the lab manual. Notice the grating has a small window through which you will look to see the spec: trum created by each light source. 2. On the other end of the scope is a narrow slit. Position the slit so it is lined up with the Hight source. It is important that you center the slit squarely with the source so no stray radiation enters the scope, since stray radiation will confuse your data. 3. Beginning with the overhead FLUORESCENT light, look through the window of the spectroscope. You should be able to see the slit at the other end and a scale to the right of the slit that looks like a ruler. 4. Along the scale you should also be able to see a series of separate colored bands. Draw a sketch of
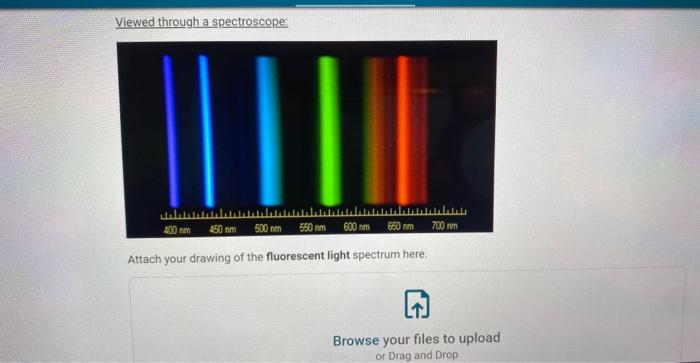
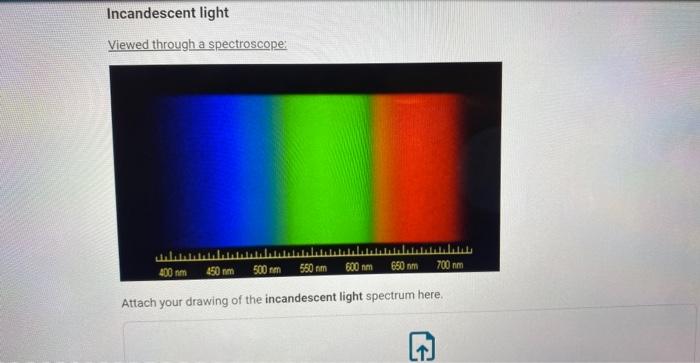
the emission spectrum on your report sheet that clearly shows the relative positions of each band on the scale, and label the color of each band. Using the scale, estimate the wavelength of each color band. 5. Now use the spectroscope to examine the INCANDESCENT light in the desk lamp provided. You should notice a very different looking spectrum from that of the fluorescent lamp; this is because you are looking at "white" light which contains every possible wavelength of the visible range. Using colored pencils provided, draw a sketch of the emission spectrum on your report sheet that clearly describes what you see. Examine the fluorescent light and incandescent light spectra. Draw your observations for the fluorescent and incandescent light spectra and upload your drawings below. Your drawing should clearly show the relative positions of each band on the scale and the bands should either be drawn in the correct color or labelled with a description of the color. You may wish to download the scale below to use in your drawings.
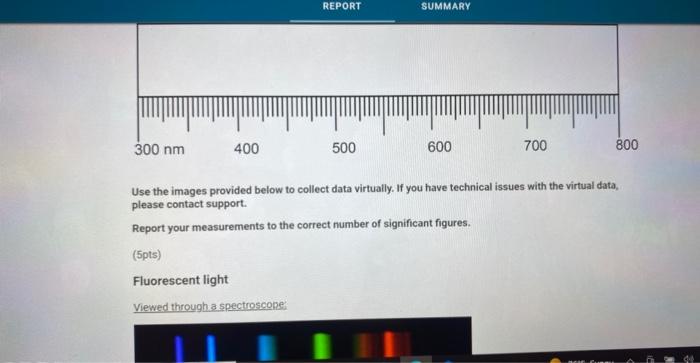
Use the images provided below to collect data virtually. If you have technical issues with the virtual data, please contact support. Report your measurements to the correct number of significant figures. (5pts) Fluorescent light Viewed througha spectroscone:
Viewed through a spectroscepe: Attach your drawing of the fluorescent light spectrum here.
Incandescent light Viewed through a spectroscope: Attach your drawing of the incandescent light spectrum here.
(50pts) Part B. Spectroscope Analysis of Atomic Gases Frow the procedure Use the spectroscope to view the emission spectrum for each of the gas discharge tubes located in the hoods. Each one contains a different atomic gas that is being excited by electricity. On your report sheet, clearly record the identity of your three gasses and the scale position \( (40.1) \) and color of ALL bands observed for each lamp. Describe the appearance of each lamp as you view it naturally without the scope. In other words, what color(s) does each one give off as you look at it? Be descriplive.
Draw your observations for the spectra of the three discharge tubes that you observed and upload your drawings below. Your drawing should clearly show the relative positions of the major bands on the scale and the bands should either be drawn in the correct color or labelled with a description of the color. You may wish to download the scale below to use in your drawings:
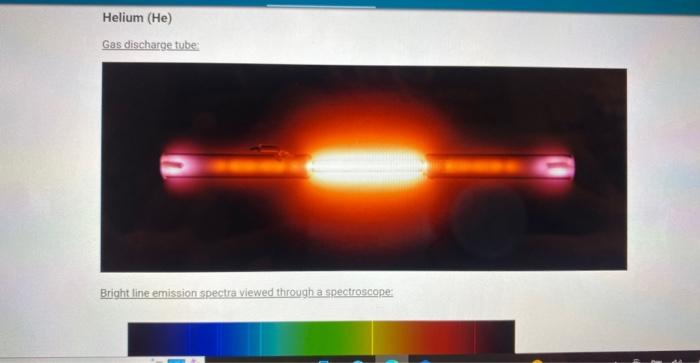
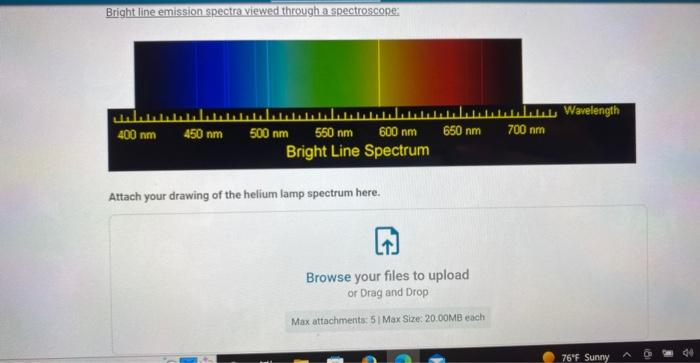
Helium (He) Gas discharge tube: Bright line emission spectra viewed through a spectroscope:
Bright line emission spectra viewed through a spectroscope: \( 400 \mathrm{~nm} \quad 450 \mathrm{~nm} \quad 500 \mathrm{~nm} \quad 550 \mathrm{~nm} \quad 600 \mathrm{nn} \) Bright Line Spectr Attach your drawing of the helium lamp spectrum here.
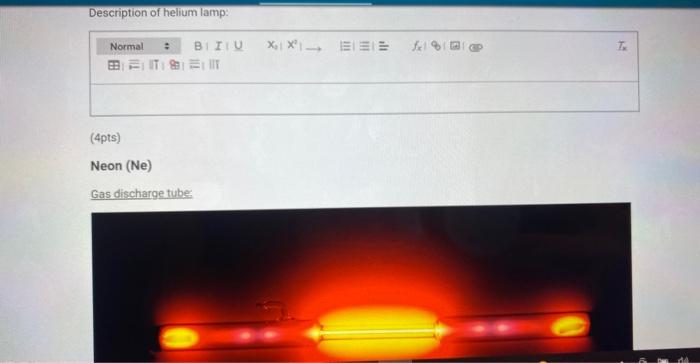
(4pts) Neon (Ne) Gas discharge tube:
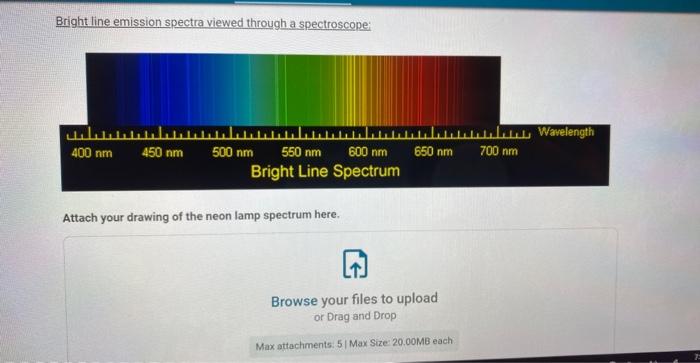
Bright line emission spectra viewed through a spectroscope: Attach your drawing of the neon lamp spectrum here.
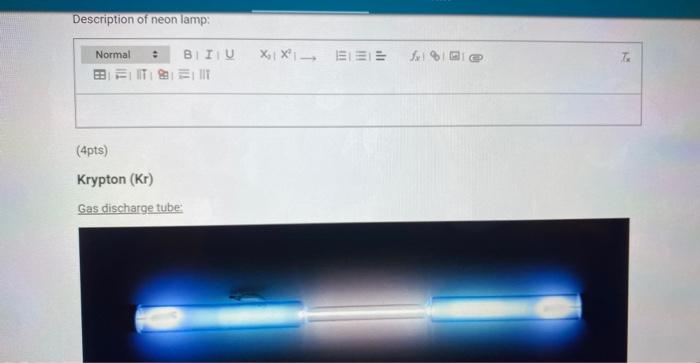
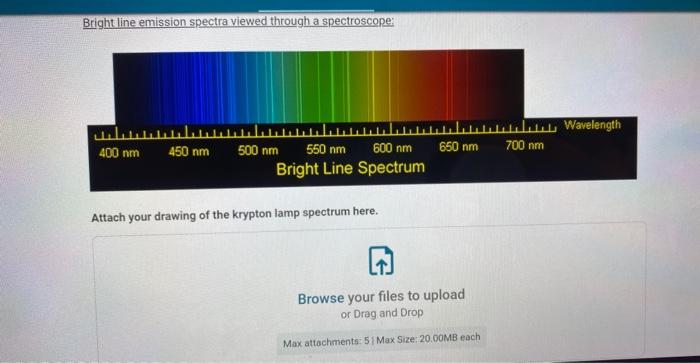
Description of neon lamp: (4pts) Krypton (Kr) Gas discharge tube:
Bright line emission spectra viewed through a spectroscope: Bright Line Spectr: lamp spectrum here.
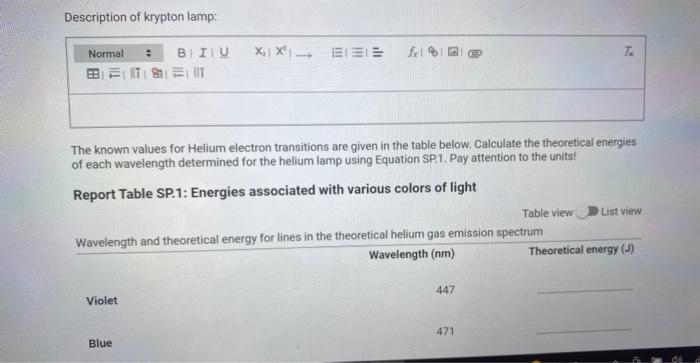
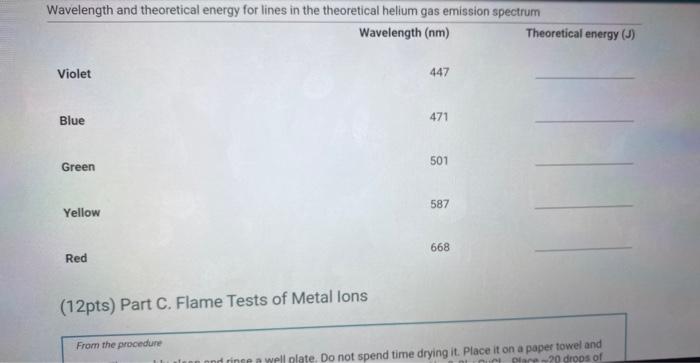
Description of krypton lamp: The known values for Helium electron transitions are given in the table below. Calculate the theoretical energies of each wavelength determined for the helium lamp using Equation SP.1. Pay attention to the units! Report Table SP.1: Energies associated with various colors of light Table view List view ipectrum
(12pts) Part C. Flame Tests of Metal Ions From the procedure on a paper towel and
Expert Answer
Compare the two observed spectra 1. Incandascent light gives a contineous s